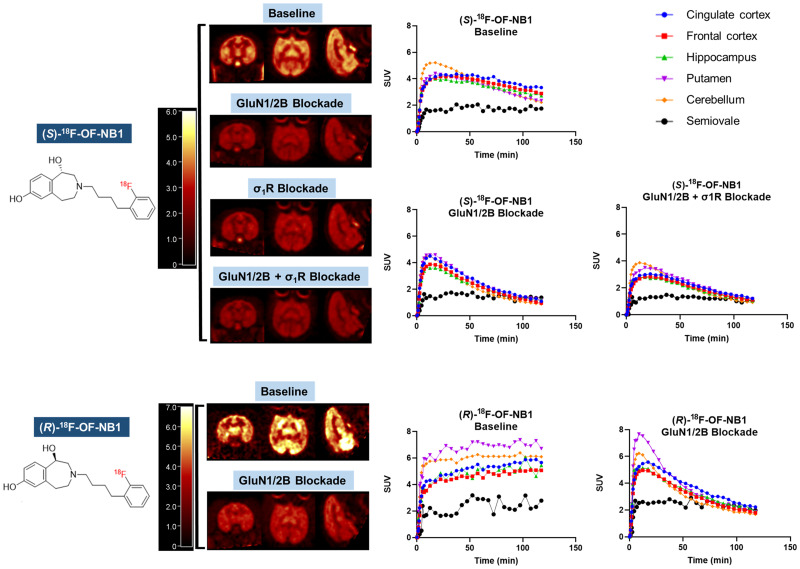
FIGURE 4.
(Top) Representative PET SUV images (summed from 45 to 60 min) and time–activity curves in selected brain regions from baseline, GluN1/2B blockade (0.25 mg/kg dose of Co 101244), σ1R blockade (0.125 mg/kg dose of FTC-146), and sequential GluN1/2B/σ1R blockade (0.25 mg/kg dose of Co 101244 + 0.125 mg/kg dose FTC-146) scans of (S)-18F-OF-NB1 obtained in the same rhesus monkey (monkey 2). (Bottom) PET SUV images and time–activity curves from baseline and GluN1/2B blockade (0.25 mg/kg dose of Co 101244) scans of (R)-18F-OF-NB1 (monkey 1).

