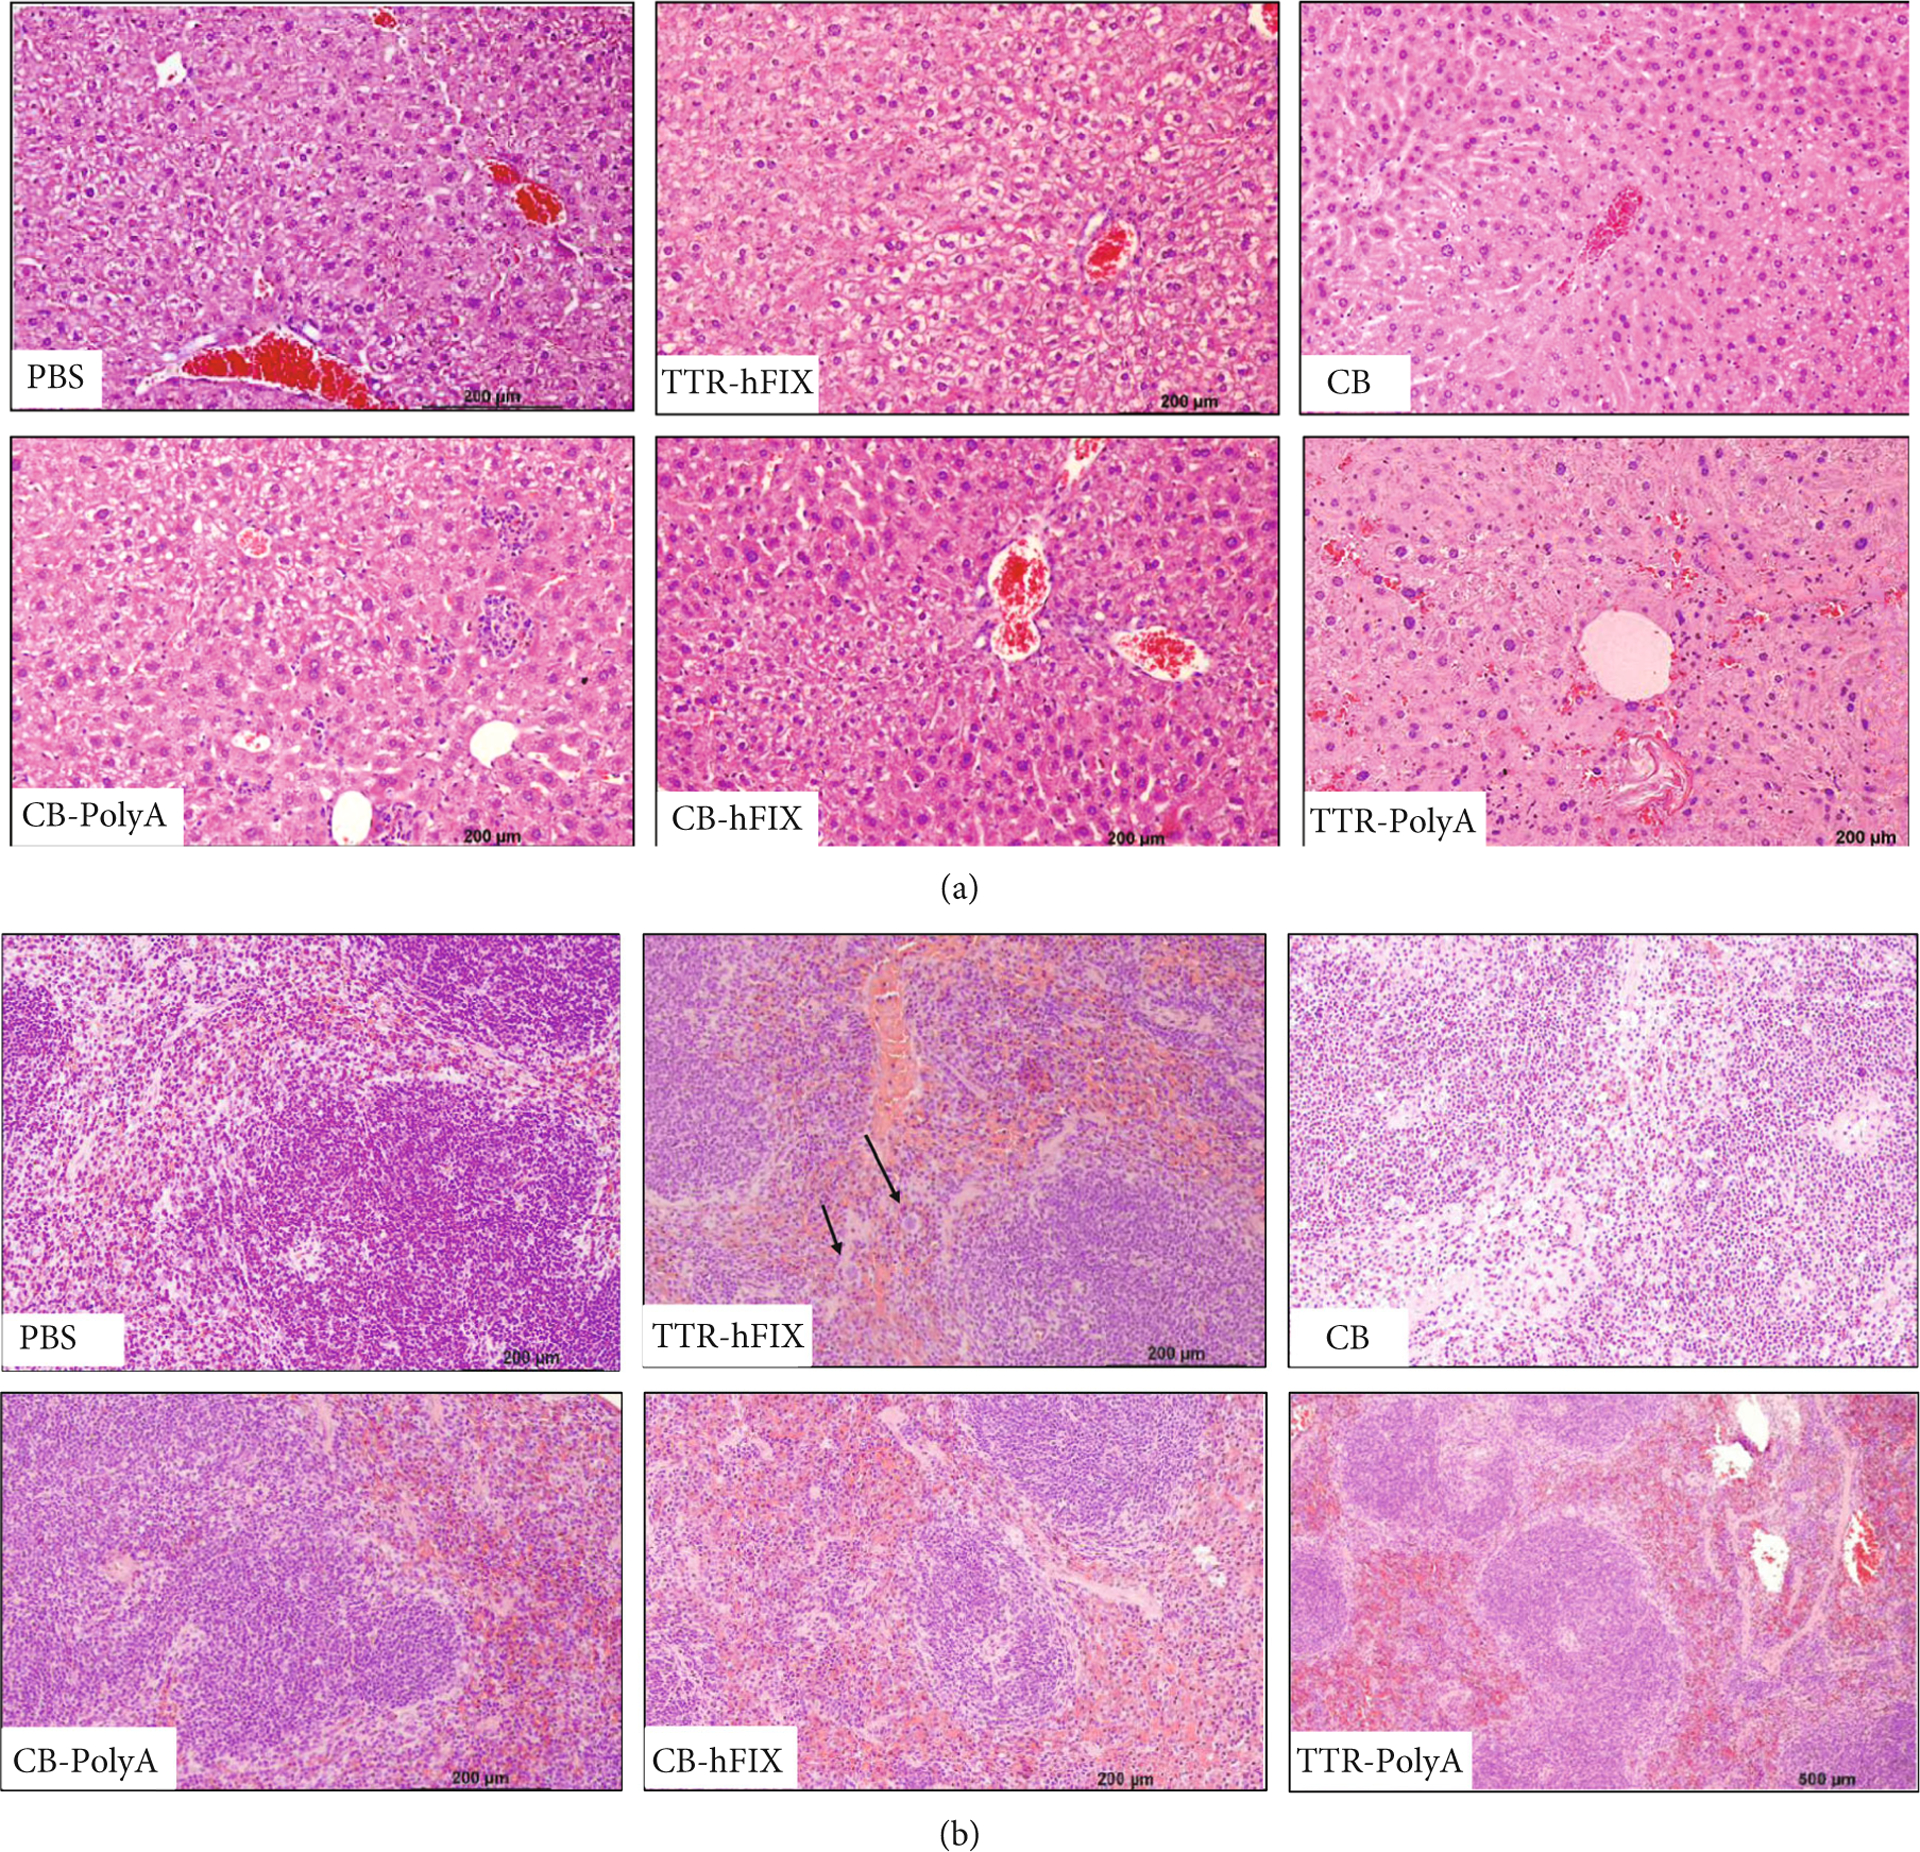
Figure 8:


Pathology report of HemB livers and spleens via H&E. (a) Images of livers from designated groups. Cytoplasmic clearing is seen in most groups, as well as EMH. Liver fibrosis seen in TTR-PolyA. (b) Images of spleens from designated groups. Splenic congestion of red pulp was common across groups. Black arrows indicate megakaryocytes in TTR-hFIX mouse. (c) Pie charts indicating number of mice from each group positive for specific features. Most common features across groups were cytoplasmic clearing in livers and splenic congestion. Total mice analyzed for study is 28 (Control = 6, TTR-hFIX = 3, CB = 3, CB-hFIX = 5, CB-PolyA = 7, and TTR-PolyA = 4).
