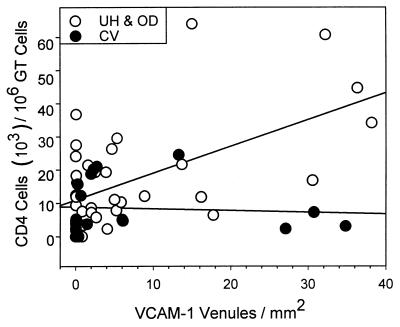
FIG. 4.
Correlation of CD4 cells and VCAM-1 expression in the upper versus the lower GT. GTs from individual mice were divided into the upper tract (UH plus OD regions) and the lower tract (CV region) and stained for anti-CD4. The number of CD4 cells was paired with the number of VCAM-1-positive venules per square millimeter for days 0, 7, 14, 21, 35, and 49. Correlation coefficients were obtained using the Spearman rank order test; P < 0.04, n = 37 for the upper GT, and P = 0.156, n = 18 for the lower GT.

