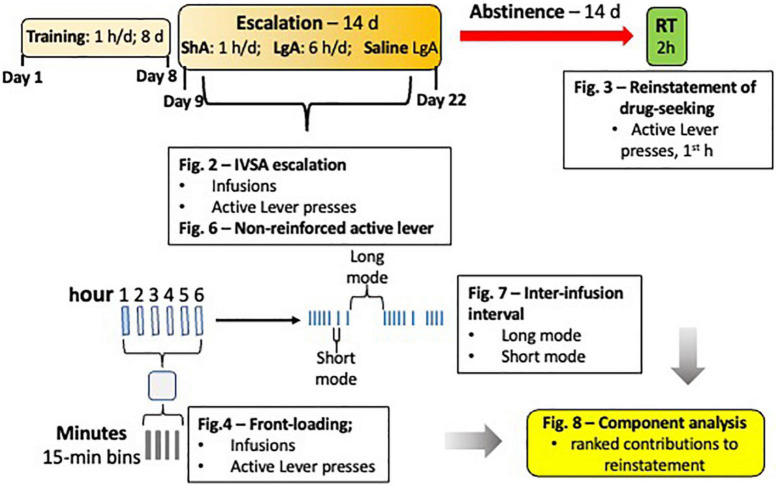
FIGURE 1.
Experimental Schematic. The IVSA paradigm is depicted with the orange boxes, forced abstinence with the red arrow, and the reinstatement test with the green box. A blow up of one example day is shown below the overall schematic, with an example IVSA session represented as long access (LgA), with 6 bars representing 6 h [First blue bar indicates a short access (ShA) session)]. Below that, 1 h of one session is represented by 4 smaller bars representing 15-min bins. To the right of the blow up of a representative session is an example of infusion patterns, with blue ticks representing infusions. Text boxes represent the behavioral measures analyzed for sex differences and used in regression analyses to determine contribution to reinstatement responding and ability to predict magnitude of reinstatement.

