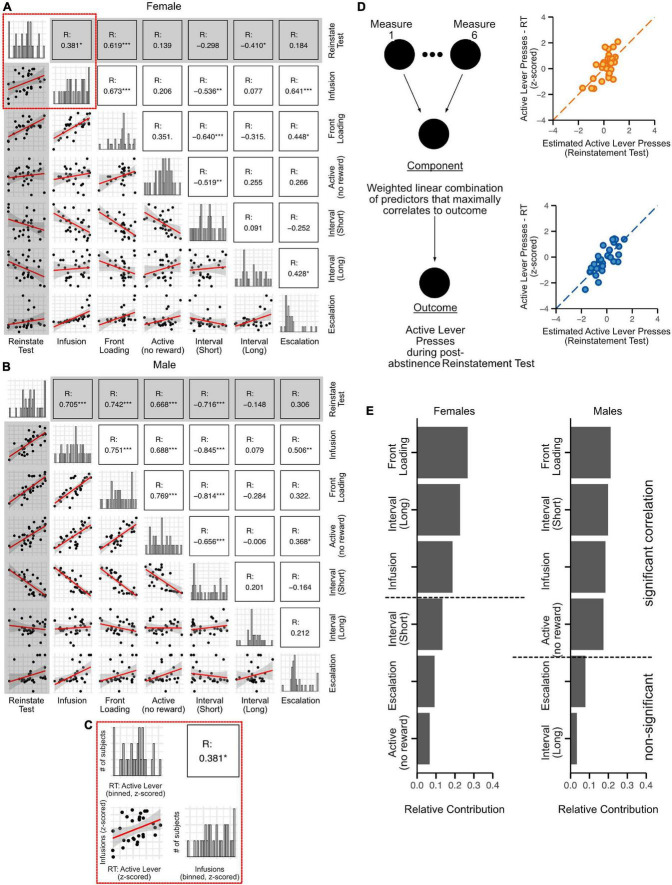
FIGURE 8.
Relative contribution of behavioral measures associated with oxycodone self-administration to post-abstinence reinstatement responding. The 6 behavioral measures quantified in the previous figures [Infusions, front-loading, non-reinforced active lever pressing, Inter-infusion intervals (short and long modes), Escalation] were segregated by sex, z-scored, and correlated with reinstatement responding (Pearson’s). For both females (A) and males (B), histograms across the diagonal represent z-scored distributions of each measure. The inset (C) provides enlarged visualization of each component of the matrix. In the histograms, the X-axis represents the z-scored measures, while the Y-axis represents the number of rats. The correlation plot in panel (C) shows the relationship between z-scored active lever presses in the reinstatement test (RT: active lever) and z-scored oxycodone infusions (infusion). The correlation matrix (below the diagonal of histograms) represents the cross-correlation between all the measures, while the matrix on top shows the correlation coefficients (R). Significant correlations are indicated with asterisks. Gray highlighted squares show comparisons of reinstatement test responding with each behavioral measure: correlation plots are in the gray-shaded column and correlation coefficients (R) are in the gray-shaded row. (D) Schematic showing the partial least square regression model used to determine the role of each measure to reinstatement responding. The dot plots in panel (D) (orange circles, females and blue circles, males) were generated with the partial least square regression model and demonstrate a tight fit between observed reinstatement responses vs predicted ones. Bar plots were generated indicating the relative contribution of each behavioral measure to reinstatement test responding in female and male rats (E). N: 30 females, 29 males.

