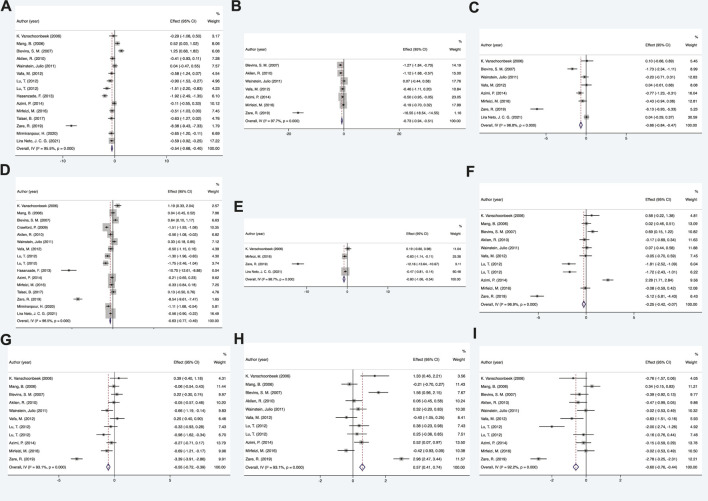
FIGURE 2.
Mean difference in the changes in glycolipid metabolism indexes. (A) FPG, (B) BMI, (C) insulin, (D) HbA1c, (E) HOMI-IR, (F) TC, (G) LDL-c, (H) HDL-c, and (I) TG. FPG, fasting plasma glucose; BMI, body mass index; HbA1c, glycated hemoglobin A1c; HOMA-IR, homeostatic model assessment of insulin resistance; TC, total cholesterol; LDL-c, low-density lipoprotein cholesterol; HDL-c, high-density lipoprotein cholesterol; TG, triacylglycerol.

