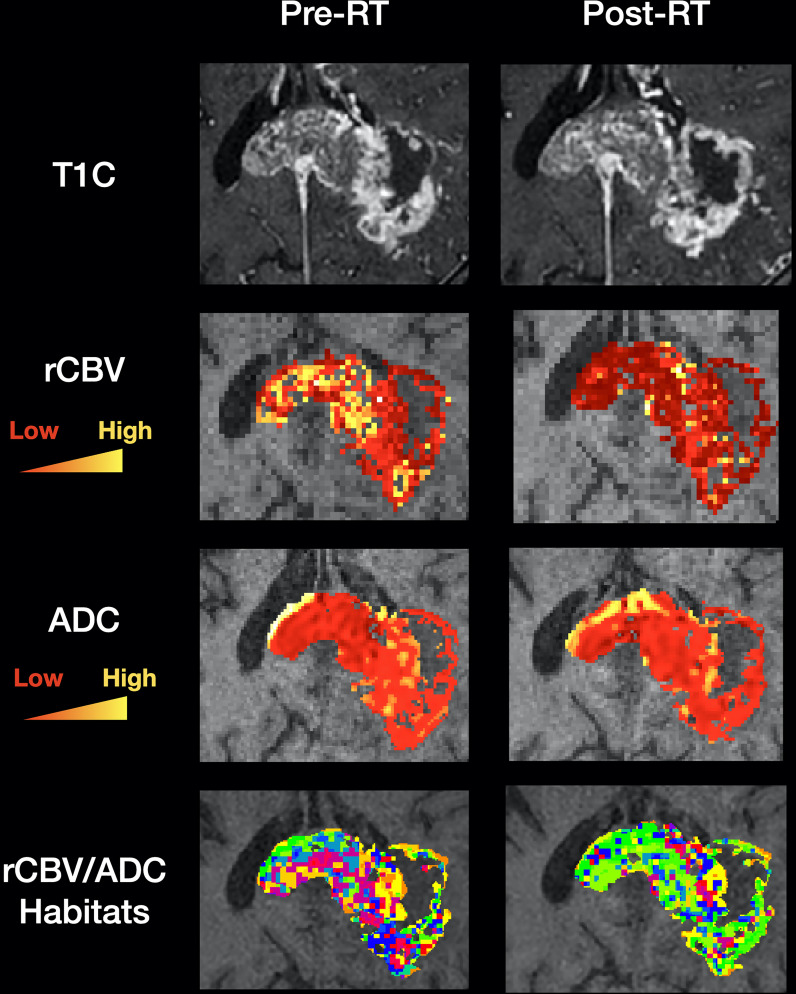
Figure 1.
Clinical utility of habitat imaging in glioblastoma: assessment of changes pre and post-radiotherapy. This figure demonstrates the clinical utility of habitat imaging in glioblastoma pre and post-radiotherapy. Top row – structural imaging (T1 with contrast) demonstrates no significant changes in tumour anatomy. Middle two rows – diffusion and perfusion MRI scans demonstrate changes in tumour physiology with treatment with a decrease in rCBV for example (red to yellow represents low to high values for each biomarker). Bottom row – imaging habitats map where each voxel is labelled according to both rCBV and ADC values. This method produced 16 different habitats for this patient. After radiotherapy, the biggest increase was in a habitat defined by low rCBV and low ADC (10.5% increase). The biggest decrease was in a habitat defined by high rCBV and medium ADC (5.7% decrease). Habitats that are more resistant to treatment can be spatially visualised and offered targeted therapy. RT, radiotherapy; T1C, T1 with contrast; rCBV, relative cerebral blood volume normalised to contralateral white matter; ADC, apparent diffusion coefficient.

