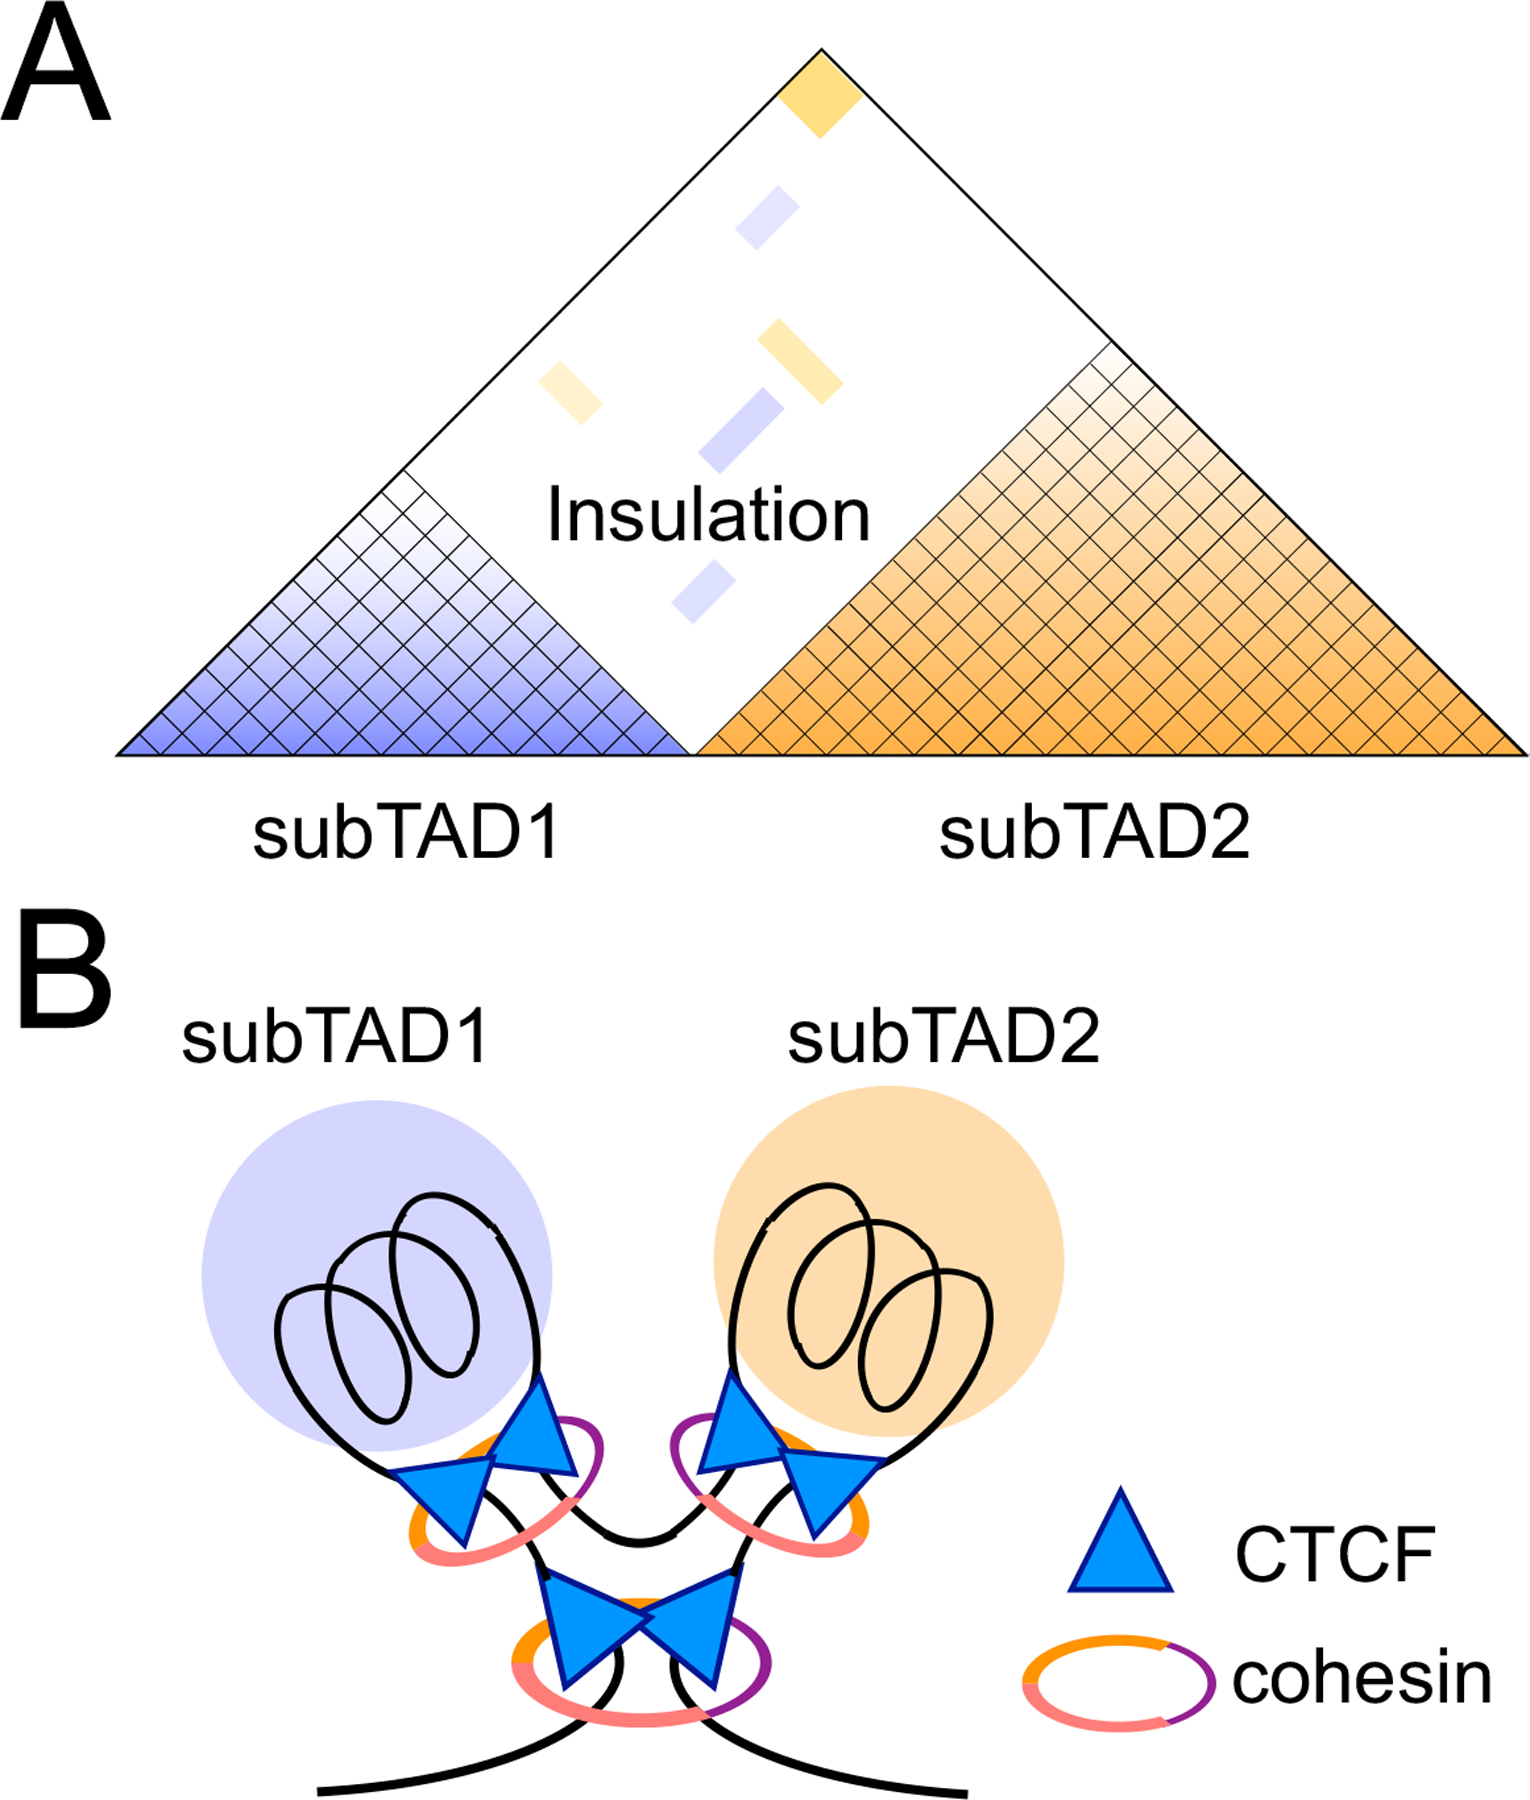
Figure 1. Organization of the genome into topologically associating domains (TADs) is orchestrated by architectural proteins.

A. Diagram representation of a TAD that harbors subTADs in a nested configuration. Color gradient in each subTAD denotes chromatin interaction frequency as measured with Hi-C, and scarcity of chromatin contacts between subTADs represents an insulation effect.
B. Illustration showing positioning of CTCF and cohesin architectural proteins in organizing a TAD and subTADs. Different colors in the cohesin ring denote its major components, SMC1, SMC3, and RAD21. The top vertices of CTCF triangles are positioned to represent the most frequently observed convergent orientation of CTCF motifs at the TAD/subTAD boundaries. It should be noted that not all boundary CTCF motifs are in the convergent orientation on the linear genome sequence.
