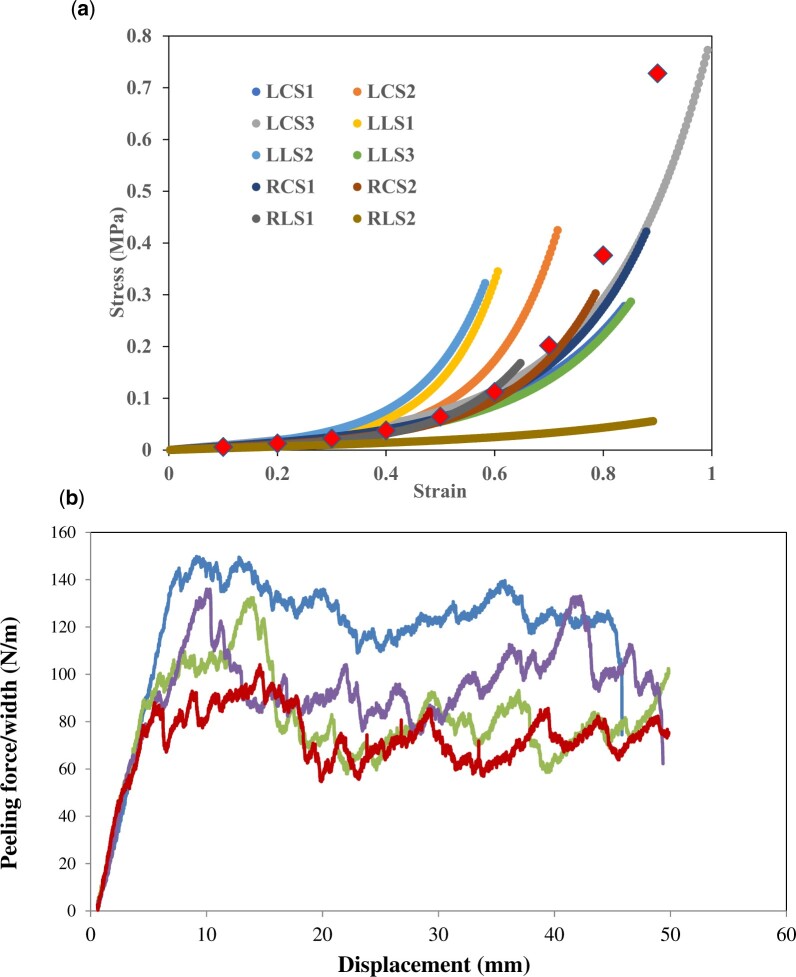
Figure 3:
(A) Uniaxial raw stress–strain data from 12 dogbone samples obtained from a single ATAA specimen. Each plotted line represents a different aortic wall sample, varying in anatomical location and orientation (longitudinal versus circumferential). (B) Graphical representation of peeling experiments for 4 separate ATAA samples. The applied peeling test causes a slow and controlled dissection propagation, where the force–displacement curve is characterized by a jagged plateau region.

