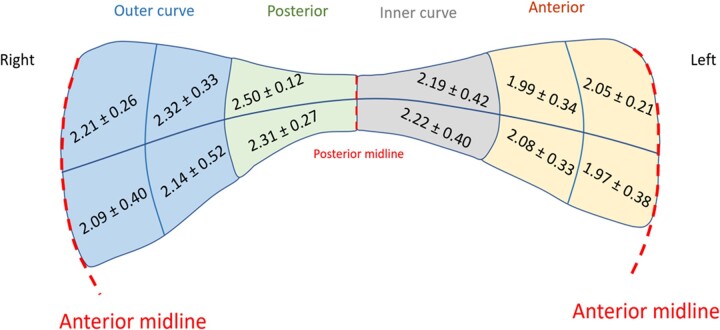
Figure 4:
Average thickness (mm) according to ascending thoracic aortic aneurysm anatomical region. Values given are mean and standard deviations according to the pre-defined regions in Fig. 1. Each region also had a superior and inferior aspect, thus giving 12 regions of derived thickness values.

