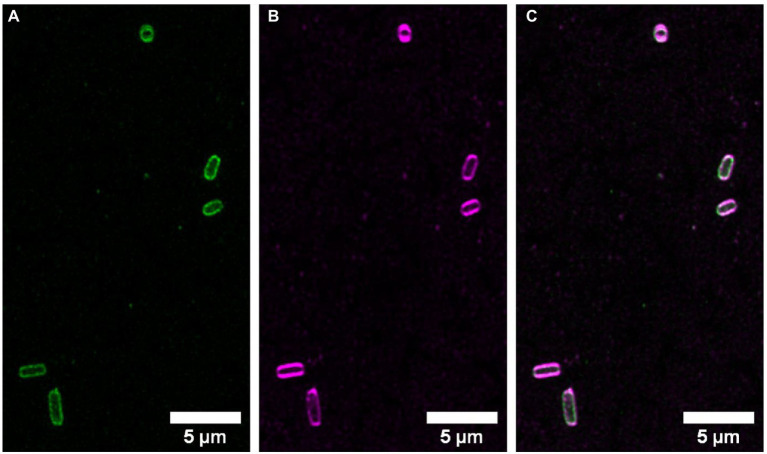
Figure 6.
NBD-DDA is localized to the cell envelope of E. coli. E. coli cells stained with (A) 10 μM NBD-DDA and (B) with the membrane stain SynaptoRed C2 (10 μM). (C) The overlay of both signals shows their colocalization. Shown are the maximum intensity projections of z-stacks with 10 slices. Image histograms were adjusted for visibility.

