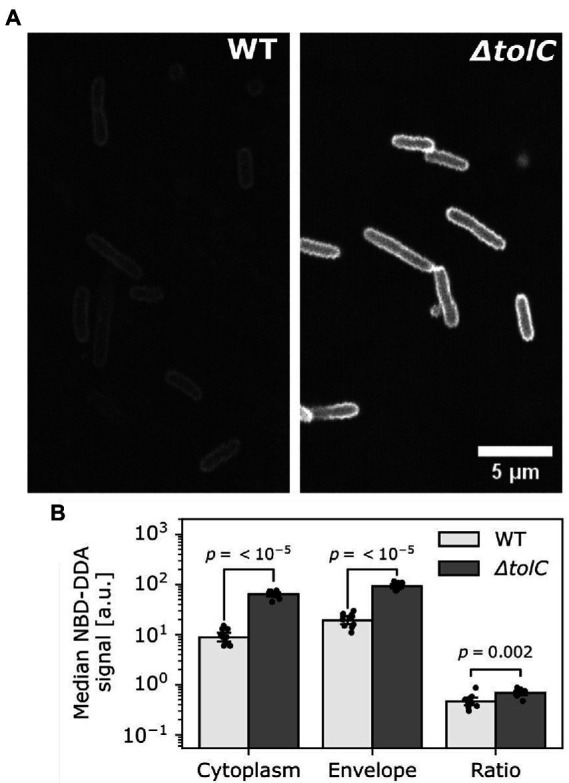
Figure 8.

TolC mediated efflux reduced NBD-DDA levels in the cell envelope and the cytoplasm. (A) Confocal laser scanning images of E. coli wild-type (WT) and ΔtolC. Shown are single z-slice raw images recorded with identical settings between strains. (B) Quantification of fluorescence pixel intensities within cell contours (cytoplasm) and on the cell contours (envelope), as well as the ratio of cytoplasm over envelope intensity. p-values were obtained from unpaired, two-tailed t-tests of the median pixel intensities of at least 10 pixels. Bars indicate mean of N = 10 cells. Black dots indicate individual cells. Errors are 95% confidence intervals of the mean obtained by bootstrapping.
