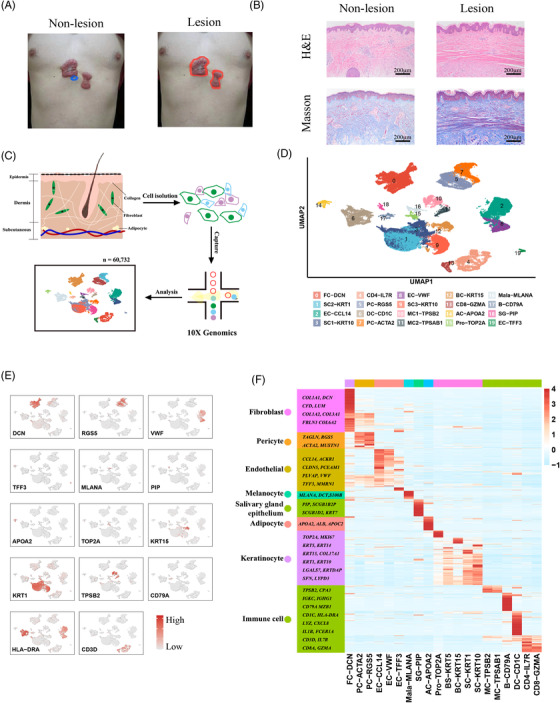
FIGURE 1.

Analysis of cell types and molecular patterns of skin tissues at single‐cell resolution. (A) Schematic diagram detailing the sampling regimen employed in this study. Tissues (dermis and epidermis) taken from the blue‐encircled area were regarded as non‐lesion samples (left), while those taken from the red‐encircled area were regarded as lesion samples (right). (B) H&E and Masson staining of lesion regions and non‐lesion regions. (C) Flowchart of single‐cell sequencing. Skin tissue was separated into dermis and epidermis by dispase, followed by cellular dissolution, achieving a single‐cell suspension. Single‐cell sequencing was performed by 10X Genomics, and a total of 60 732 high‐quality cells were attained. (D) Uniform manifold approximation and projection (UMAP) plot of total cells. Cells were divided into 20 subgroups with identified molecules. FC, fibroblast cells; SC, spinous cells; EC, endothelial cells, CD4, CD4+ T cells; PC, pericytes; DC, dendritic cells; MC, mast cells; BC, basal cells; CD8, CD8+ T cells; AC, adipose cells; Pro, proliferative cells; Mala, melanocytes; B, B cells; and SG, sweat glands. (E) Feature plot of each cell type. Dark‐red colors signify elevated expression, while gray colors denote attenuated expression. (F) Heatmap of top expressed genes in eight primary cell types. Light‐blue colors signify low gene expression, while red colors denote elevated gene expression.
