FIGURE 2.

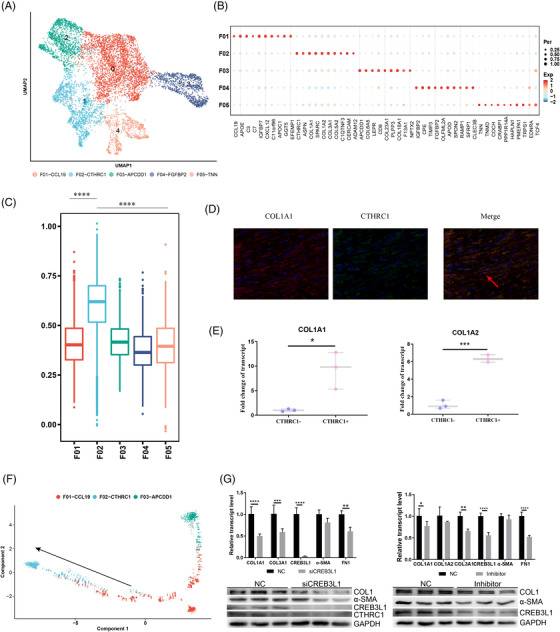
Characteristics of fibroblasts at high resolution. (A) Uniform manifold approximation and projection (UMAP) plot of fibroblasts at high resolution. Fibroblasts were divided into the five subgroups F01–F05, with each one a different color. (B) Top molecular patterns in the five subgroups. The red color designates relatively high expression, while the blue color denotes relatively low expression. The size of the circle illustrates the percentage of cells expressing the gene. (C) Gene expression of ECM model in the five subgroups based on gene ontology (GO). (D) Co‐localization staining of CTHRC1 and COL1A1 in skin tissues. Green colors designate cells expressing COL1A1, and red colors represent cells expressing CTHRC1. The red arrow shows that COL1A1 and CTHRC1 were co‐expressed in some cells. (E) CTHRC1+ cells were isolated by flow cytometry, and we found that they exhibited a higher expression of COL1A1 and COL1A2. *p < .05, ***p < .001. (F) Trajectory analysis of F01–F03. F01 may transform to F02 and F03 with pseudo‐time. (G) Gene expression of ECM‐related genes in keloid fibroblasts in which CREB3L1 interference was compared with controls; the corresponding western blot is shown at the bottom. The two‐way analysis of variance (ANOVA) was performed in this plot. (I) Gene expression of ECM‐related genes in keloid fibroblasts in which SGC‐CBP30 interference was compared with controls; the corresponding western blot is shown at the bottom. The two‐way ANOVA was performed in this plot.
