
FIGURE 3.
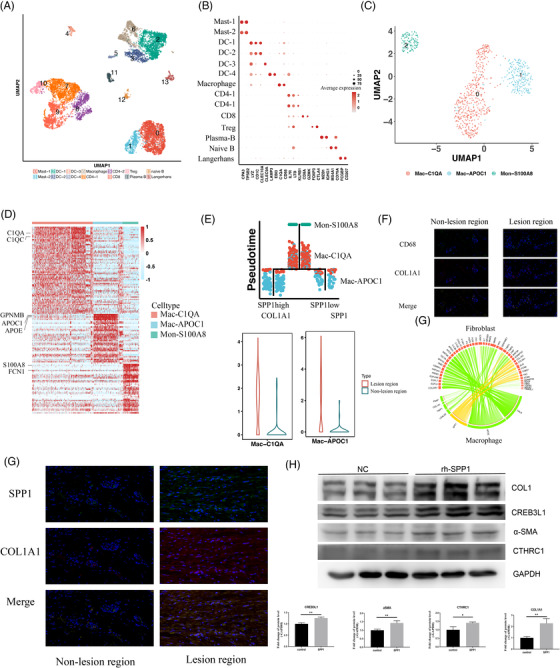
Involvement of macrophages in the pathogenesis of ECM deposition. (A) Uniform manifold approximation and projection (UMAP) plot of immune cells. Immune cells (including myeloid cells and T cells) were divided into 14 subgroups. (B) The marked molecules of each subtype are represented by dot plots. (C) UMAP plot of macrophages. Macrophages were further subdivided into three subtypes with marker molecules. (D) Heatmap of differentially expressed genes among the three macrophage subtypes. (E) Trajectory analysis of the three types of macrophages with pseudo‐time indicated that monocytes were the original cells, followed by transformation into SPP1‐low and ‐high‐expressing macrophages. Expression of COL1A1 between non‐lesion and lesion regions in Mac‐C1QA is shown at the bottom‐left, and the expression of SPP1 between non‐lesion and lesion regions in Mac‐APOC1 is shown at the bottom‐right. (F) Interaction of macrophages and fibroblasts based on molecular patterns indicated that macrophages interact with fibroblasts via SPP1. (G) Co‐localization staining of SPP1 and COL1A1 in non‐lesion and lesion regions. SPP1 was stained with the green color, while COL1A1 was stained with the red color. (H) Western blot of ECM‐related proteins with simulation by SPP1 in vitro