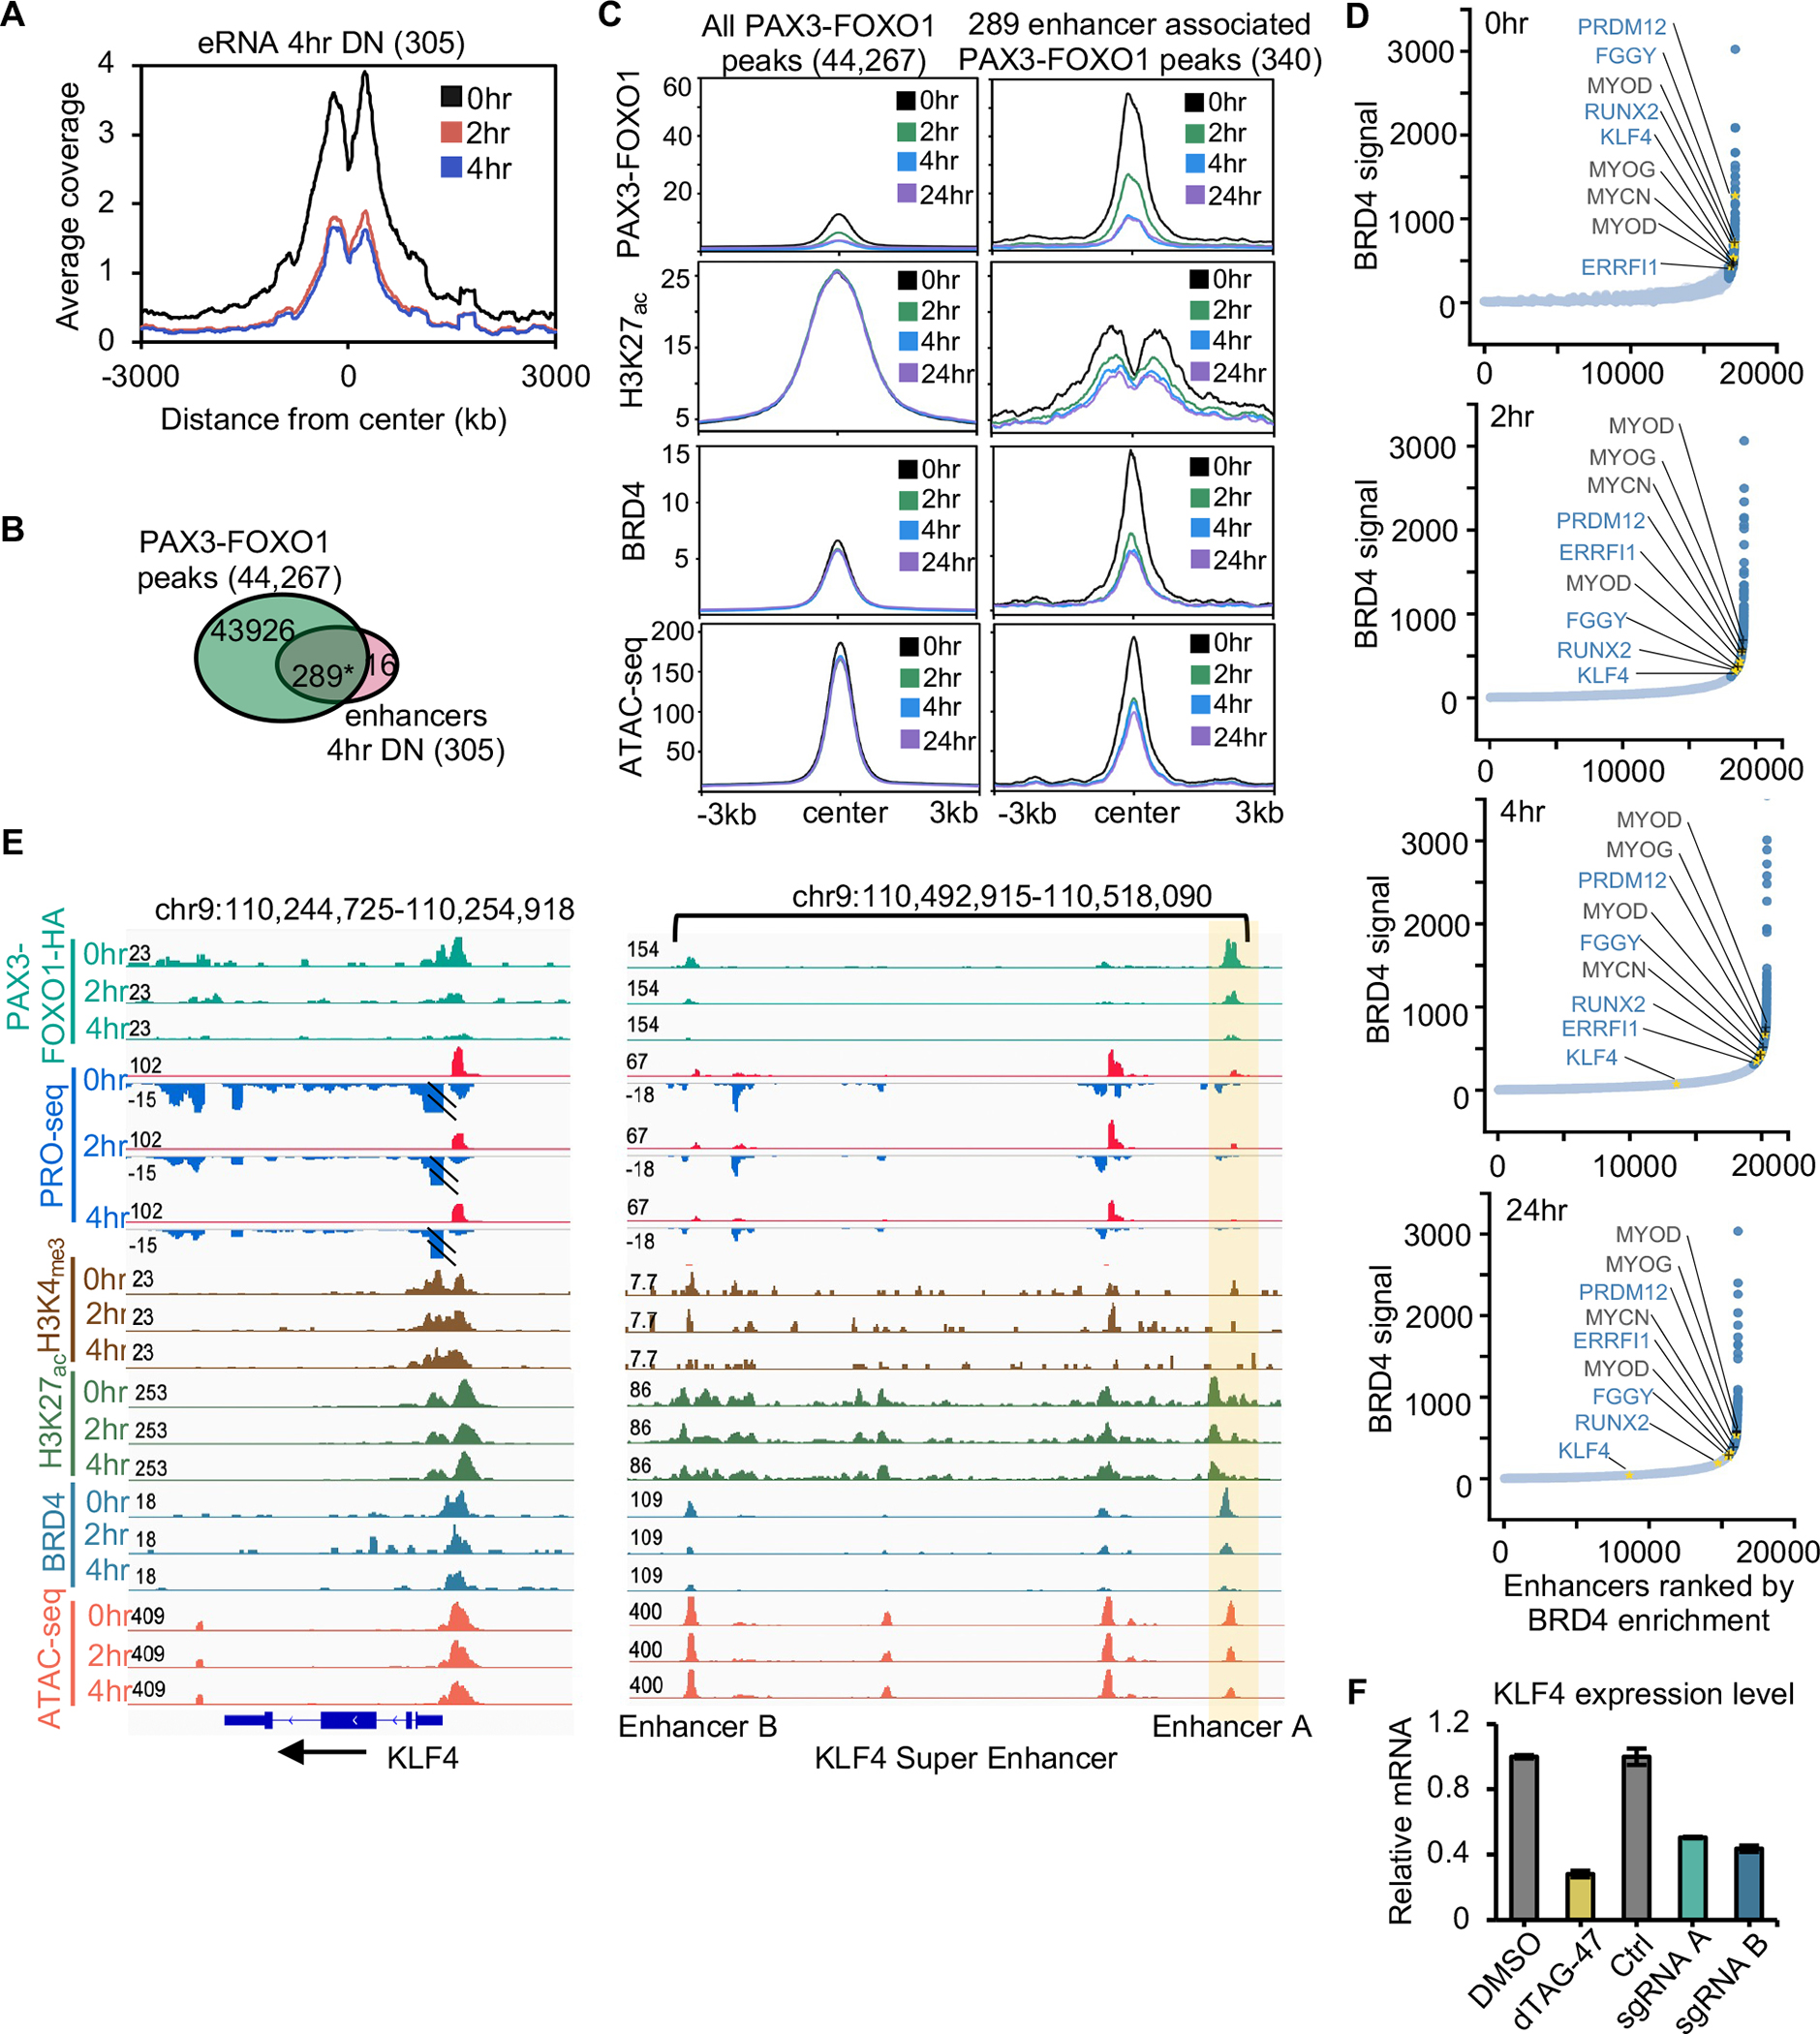
Figure 3. Identification of PAX3-FOXO1-regulated enhancers.

(A) Histogram of PRO-seq reads around enhancer centers after PAX3-FOXO1 degradation. (B) Venn diagram showing the overlap between PAX3-FOXO1 peaks and the down-regulated eRNA peaks at 4hr (*: p <= 1.0e-10). (C) Average signal of PAX3-FOXO1, H3K27ac, BRD4, and ATAC-seq over a 24hr time course of dTAG-47 treatment over the regions encompassing all PAX3-FOXO1 bound sites or those peaks associated with changes in eRNA transcription. (D) Distribution of BRD4 CUT&RUN density across the putative typical-enhancers (light blue) and super-enhancers (dark blue) in Rh30 cells at 0, 2, 4, 24 hrs following PAX3-FOXO1 degradation. Gold asterisks mark the examples of super-enhancers that are regulated by PAX3-FOXO1, and black type and + marks the examples of previously identified super-enhancers that were not regulated by PAX3-FOXO1 degradation. (E) IGV gene tracks showing a time course analysis of dTAG-47 treatment for PRO-seq and ATAC-seq coupled with localization of PAX3-FOXO1, BRD4, H3K27ac, and H3K4me3 at the KLF4 locus. Shaded area highlights a PAX3-FOXO1 regulated enhancer. (F) Bar graph reveals the relative mRNA expression of RUNX2 after deletion of either enhancer A or B.
