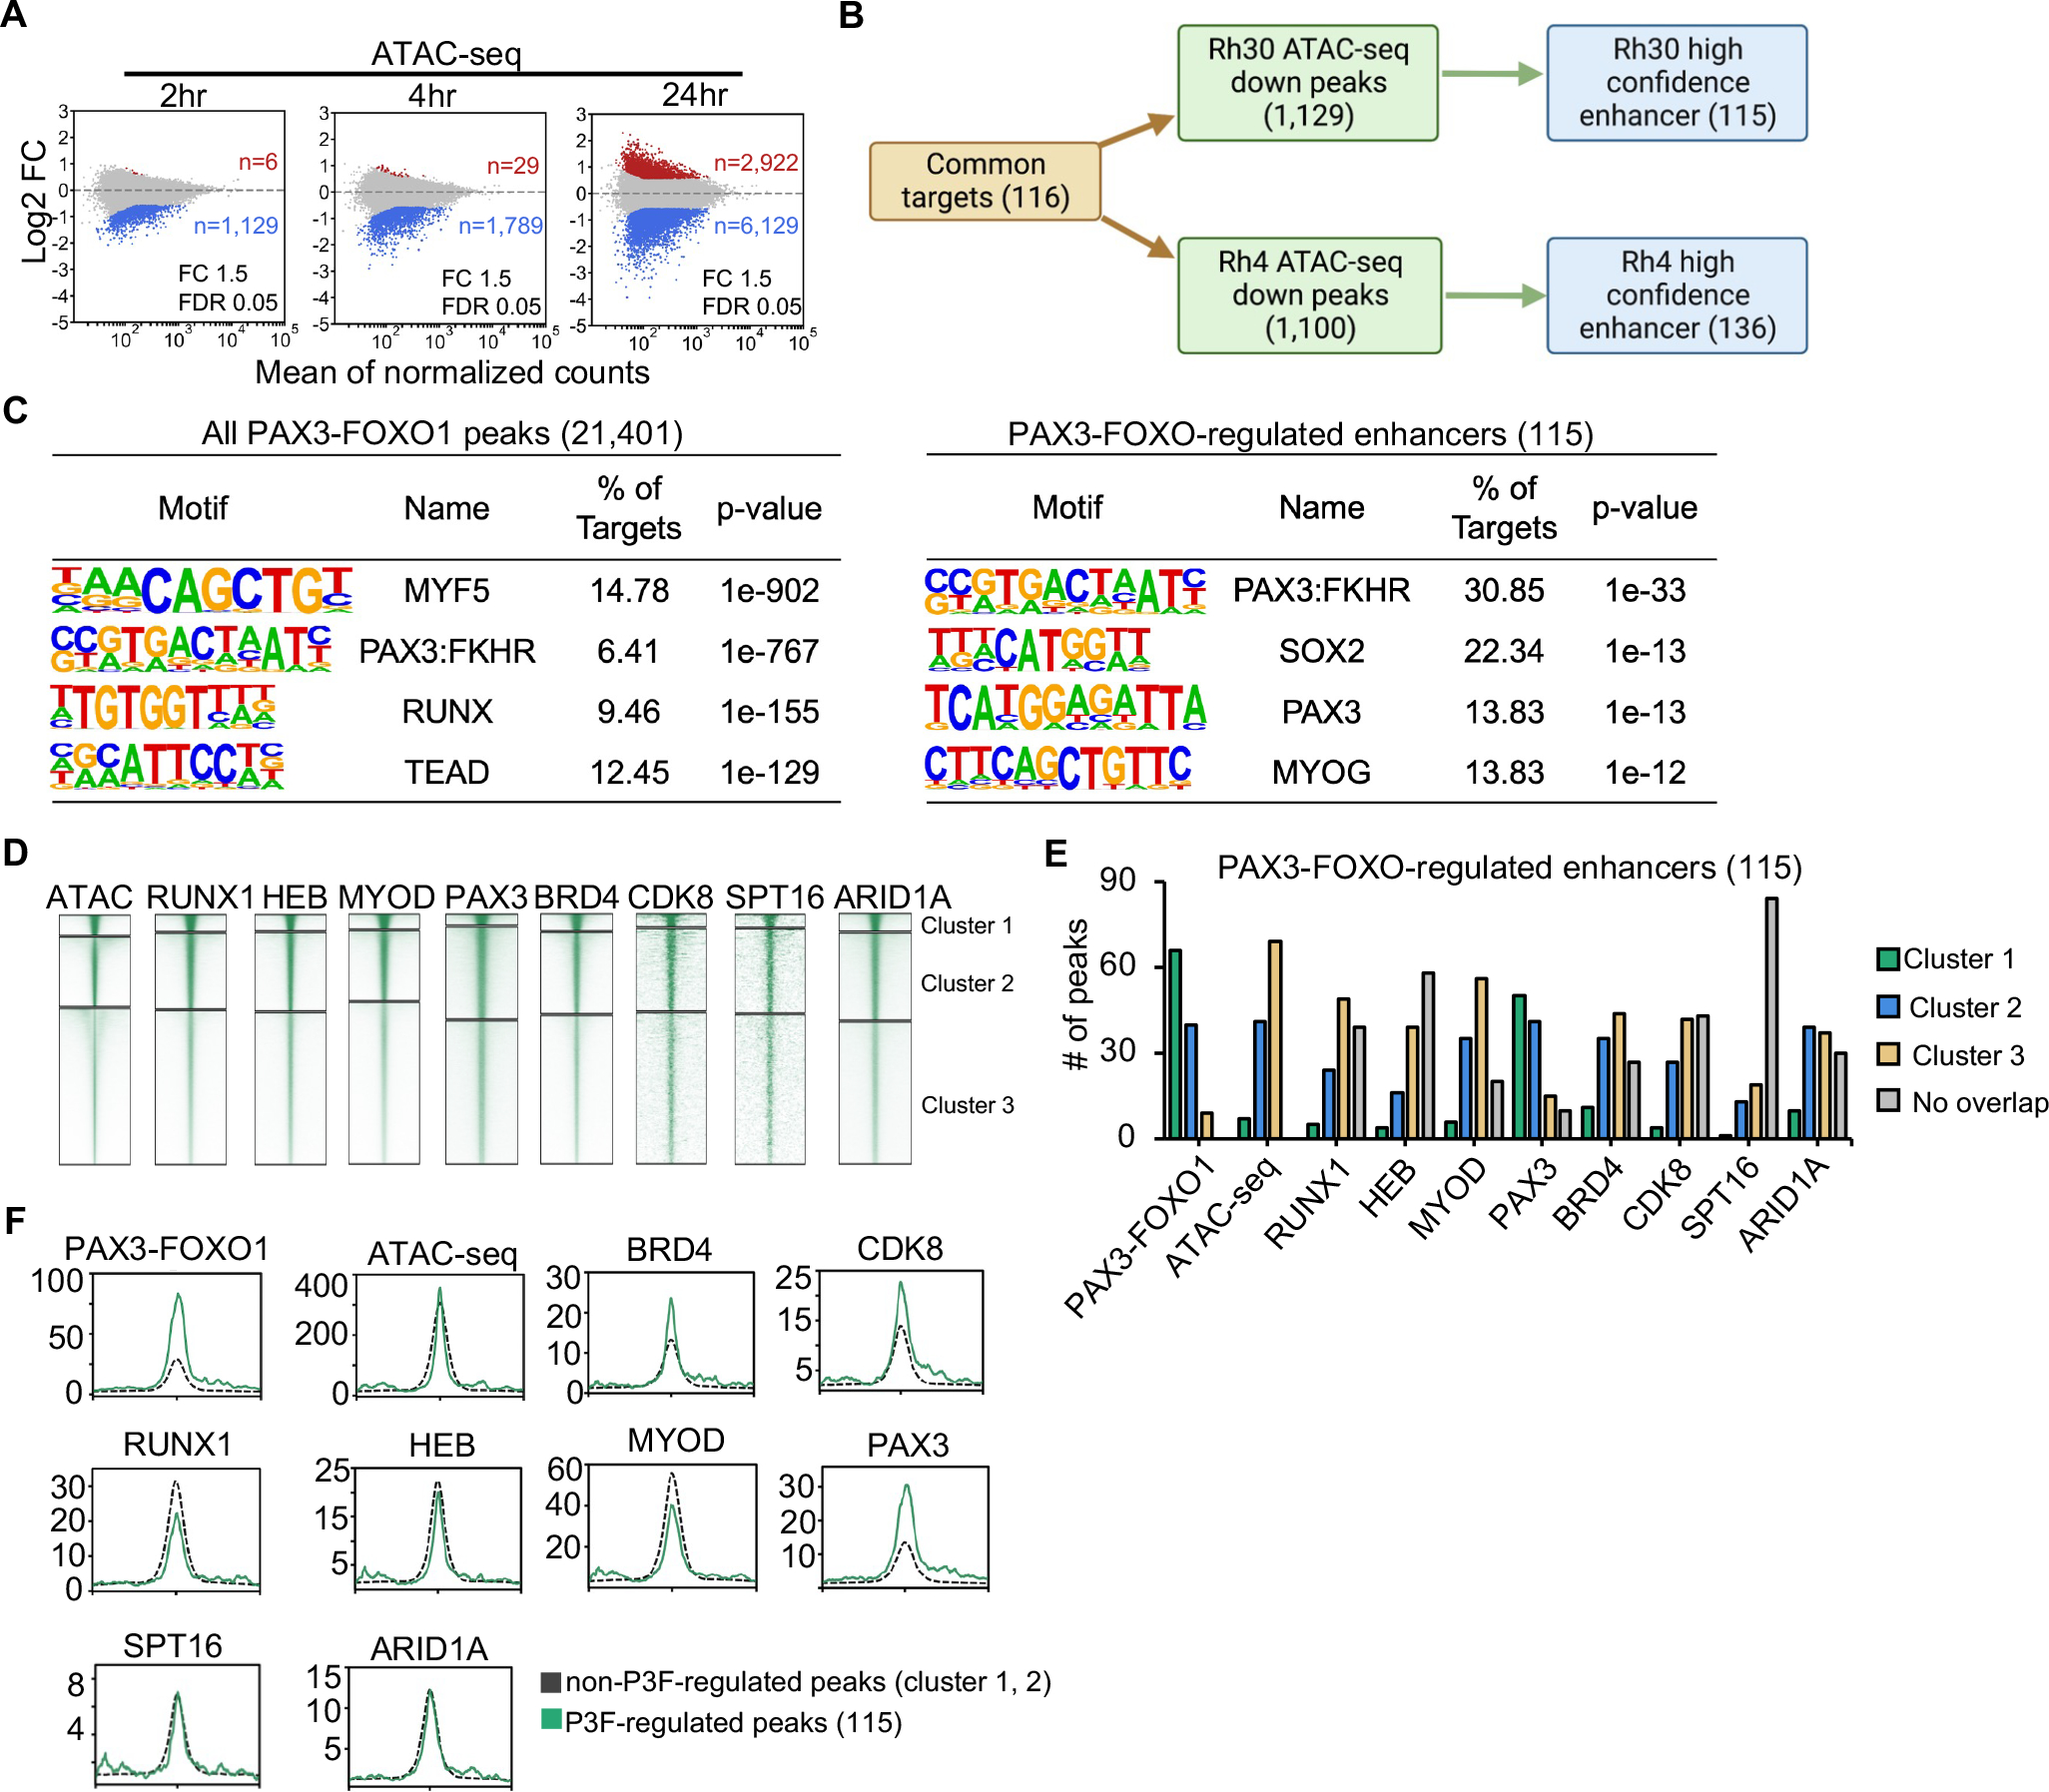
Figure 5. Comparison of PAX3-FOXO1-regulated and non-regulated binding sites.

(A) MA plots showing ATAC-seq peak changes; red (up) or blue (down) (dTAG-47/DMSO, n=2). (B) Flow chart showing the identification of high confidence PAX3-FOXO1 regulate genes and their associated enhancers. (C) Motif analysis of the area under all PAX3-FOXO1 DNA binding peaks from the CUT&RUN analysis (left) or under the 115 ATAC-seq sites associated with genes down-regulated after PAX3-FOXO1 degradation. (D) Heatmap of the intensity of CUT&RUN or ChIP-seq signal after K means clustering of each of the indicated factors. (E) Peaks from the clusters in D that were associated with the regulated genes are shown as a bar graph. (F) Histograms of the CUT&RUN signal of the indicated factors around the regulated ATAC-seq peaks versus the remaining cluster 1 & 2 peaks from K means clustering.
