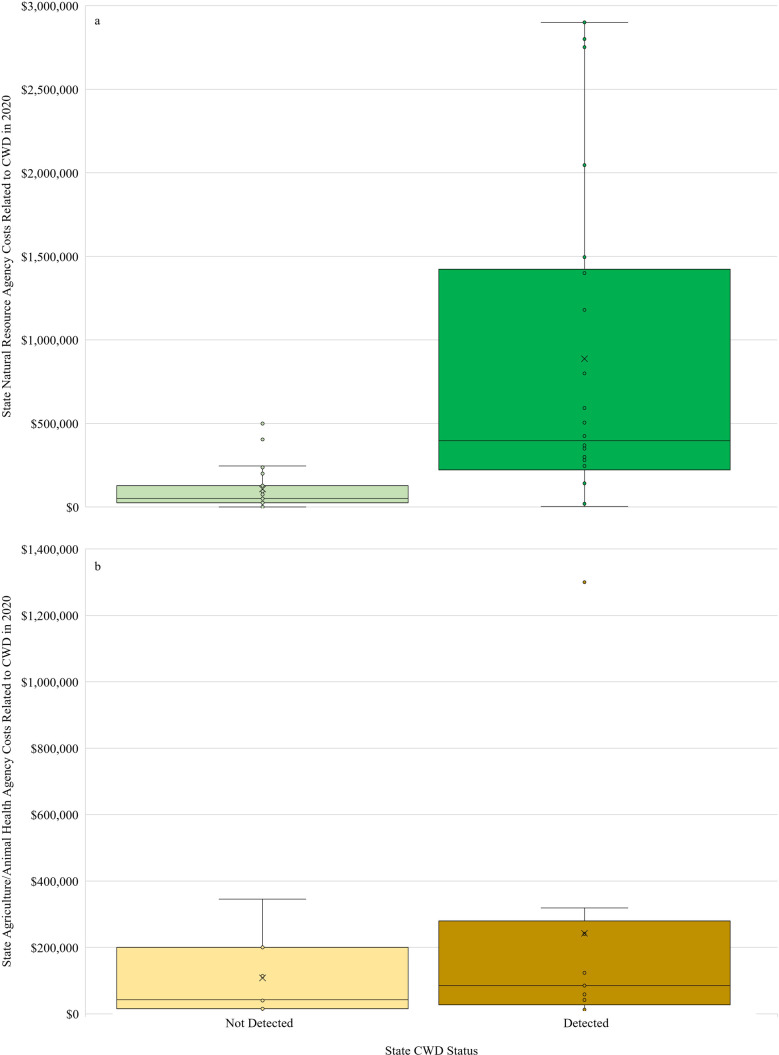
Fig 2. Distribution of reported state agency costs in fiscal year 2020 related to chronic wasting disease in states that have and have not detected the disease.
Costs are displayed for (a) state natural resources agencies (n = 49) and (b) state agriculture/animal health agencies (n = 16) within the continental United States. The ‘x’ and horizontal lines inside each box represent the mean and median, respectively. The top and bottom of each box represent the median of the 3rd and 1st quartiles, respectively. ‘Whiskers’ extending above and below each box represent maximum and minimum costs not considered outliers.

