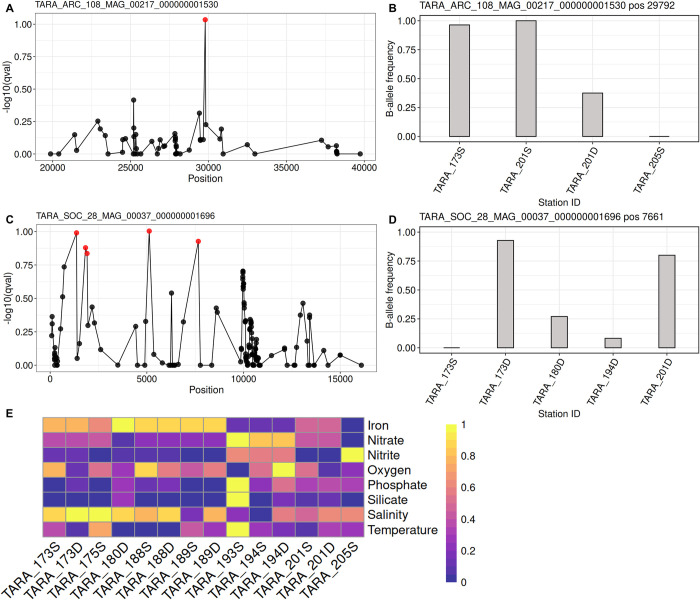
Fig 7. Selection of variants in Arctic Chaetoceros populations.
(A) and (C) represent Manhattan plots in a 10 kb window around the variants of interest, shown for ARC_217 (ISIP) and SOC_37 (spermidine/spermine synthase). Red dots correspond to SNVs considered under selection (q-value < 0.15). (B) and (D) represent the bar plots of the BAF for the respective loci of interest depending on the population considered. (E) Range-transformed heatmap of abiotic parameters for the Tara Oceans stations in the Arctic Ocean where the Chaetoceros MAGs are present (see S6 Table for raw values). The brightest yellow colour represents the most elevated values for any given parameter in the dataset, while the darkest purple indicates the lowest. D: deep-chlorophyll maximum; S: surface. BAF, B-allele frequency; ISIP, iron starvation-induced protein; MAG, metagenome-assembled genome; SNV, single-nucleotide variant.

