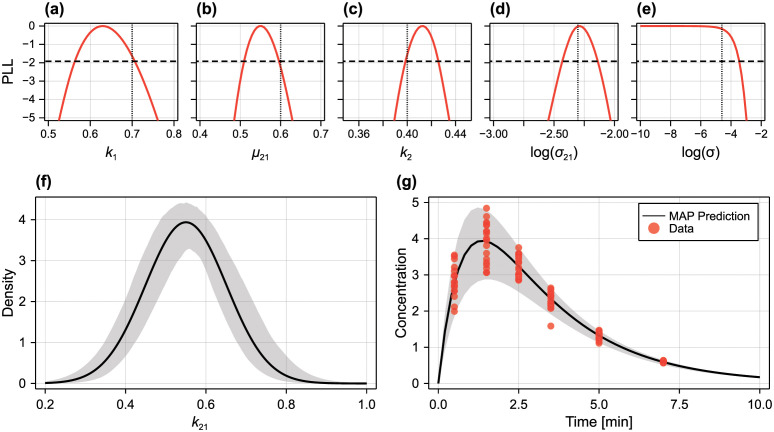
Fig 6. Identifiability analysis for two-pool model with random parameters.
(A–E) Profile likelihoods for each hyperparameter. Also shown are the true values (vertical dotted) and the threshold for a 95% confidence interval (horizontal dashed). (F) Inferred distribution of k21 showing the distribution at the MAP (black) and a 95% credible interval for the density function. (G) Synthetic data (red discs) and model prediction based on the MLE showing the mean (black) and 95% prediction interval (grey).

