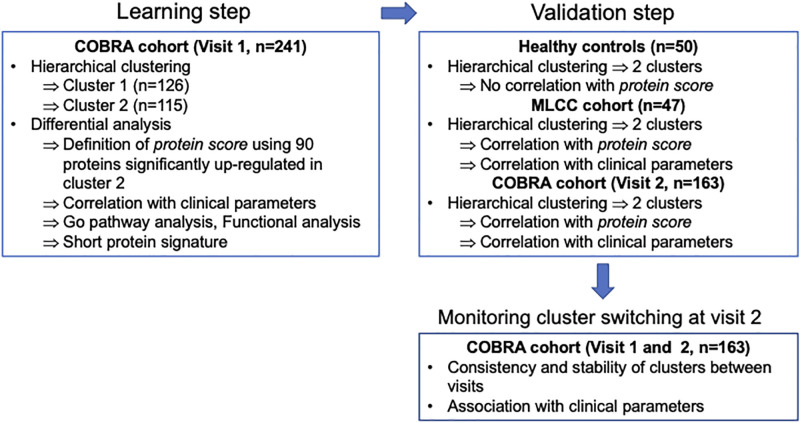
Fig 1. Study flow diagram.
Stable COPD patients (n = 241) were included in the COBRA cohort at visit 1 and serum SOMAscan analyses were performed. Two COPD clusters, Cluster 1 (n = 126) and Cluster 2 (n = 115) with distinct protein expression patterns were identified through unsupervised hierarchical clustering. The differentially expressed proteins in Cluster 2 were submitted to GO pathways analysis for further functional enrichment study, then median expression values from 90 proteins up-regulated in Cluster 2 (defined as “protein scores”) were generated for each COPD cluster. Association studies were performed between COPD clusters or corresponding protein and clinical parameters. The evolution of the clinical outcomes and of proteomic profiles was assessed in 163 COPD patients out of the 241 having a follow up visit (visit 2) after inclusion (visit 1). Expression patterns associated with Cluster 1 (n = 97) and Cluster 2 (n = 66) were verified in COBRA cohort at visit 2 on the basis of protein scores previously defined at visit 1. Protein signatures representative of each COPD cluster were identified to monitor clinical patient stability at visit 2. SOMAscan data obtained in the COBRA cohort were validated in a separate group of 47 COPD patients originating from the MLCC cohort. Serum samples from n = 50 control healthy subjects were included for comparisons.

