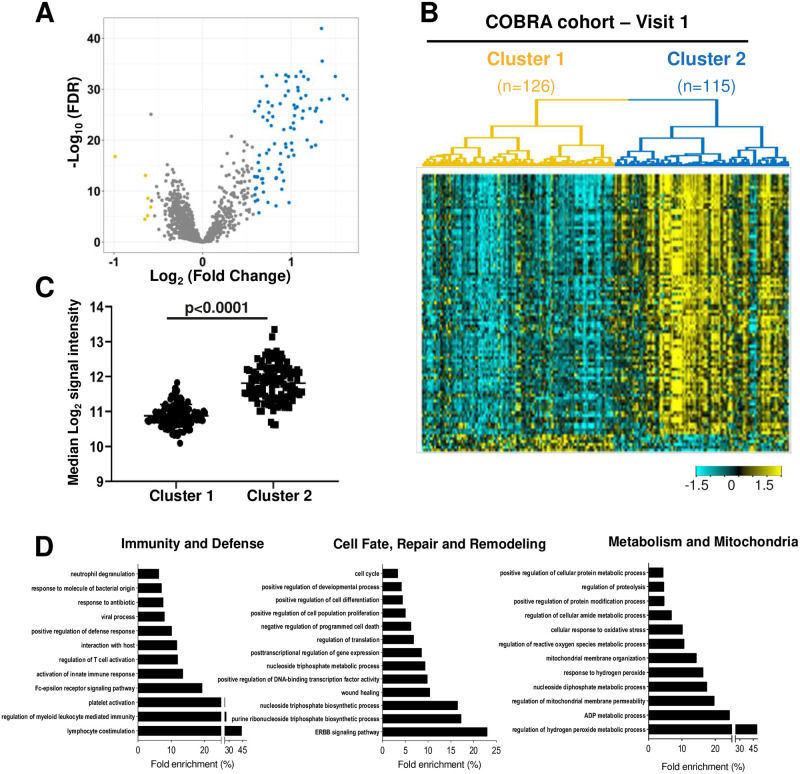
Fig 2. Two COPD patient Clusters show differentially expressed proteins enriched for distinct biological pathways.
(A) Volcano plot showing differentially expressed proteins between Cluster 1 and Cluster 2. X axis corresponds to log2 (fold change) and Y axis corresponds to -log10 (FDR). Yellow indicates proteins with significant downregulation and blue indicates those with significant upregulation (Fold change >1.5 and FDR <0.05 for both comparisons); (B) Heatmap showing the expression pattern of differentially expressed proteins between the two clusters. (C) Median expression of 90 proteins associated with Cluster 2; (D) Top GO pathways comparing Cluster 2 versus Cluster 1, regrouped in three core functions defined as “Immunity and defense”, “Cell fate, repair and remodeling”, and “Metabolism and mitochondria”.

