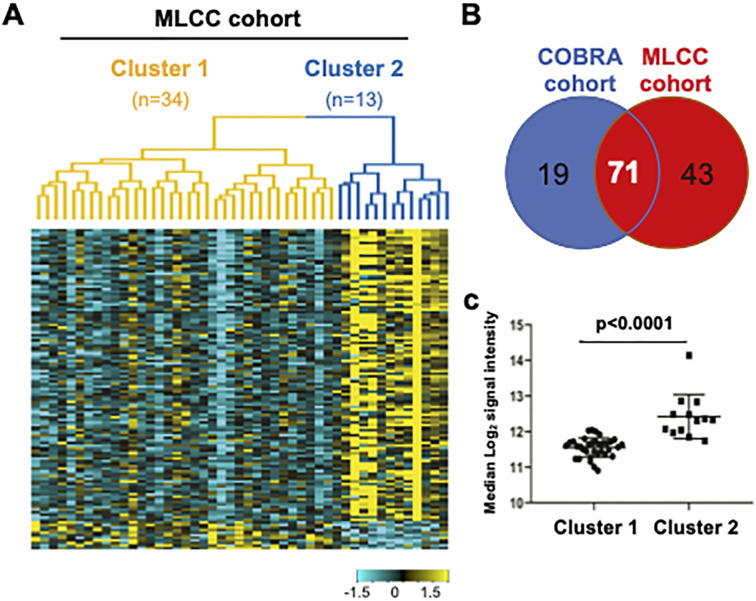
Fig 3. COPD Clusters are observed in an independent patient cohort, but not in healthy controls.
(A) Heatmap showing levels of differentially expressed proteins in the MLCC cohort. Yellow indicates high expression and cyan indicates low expression. (B) Overlap of the Cluster 2-associated up-regulated proteins (Fold change >1.5 for Cluster 2 vs Cluster 1 and FDR <0.05) between COBRA and MLCC cohorts. (C) Protein score (defined in CORBA cohort) in Cluster 1- and 2 in the MLCC cohort.

