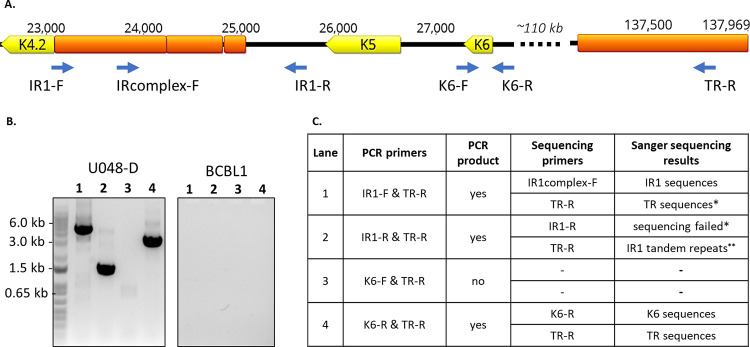
Fig 2. Confirmation of breakpoints connecting IR1 and K6 to TR sequences in tumor U048-D.
A. The region of the KSHV genome from K4.2 through K6 and a distant TR unit sequence is shown. ORFs are shown in yellow, repetitive sequences in orange, and primers with blue arrows. B. PCR products were separated on a 0.8% agarose gel, and visible bands were extracted and sequenced using the Sanger method. DNA from the BCBL1 cell line was used as control, and no visible PCR products were produced. (PCR products from primer pairs IR1-F & IR1-R and K6-F & K6-R are shown in S1 Fig). C. Summary of results. * = Primarily due to ambiguous and low quality base calls. ** = Result truncated at 200bp.

