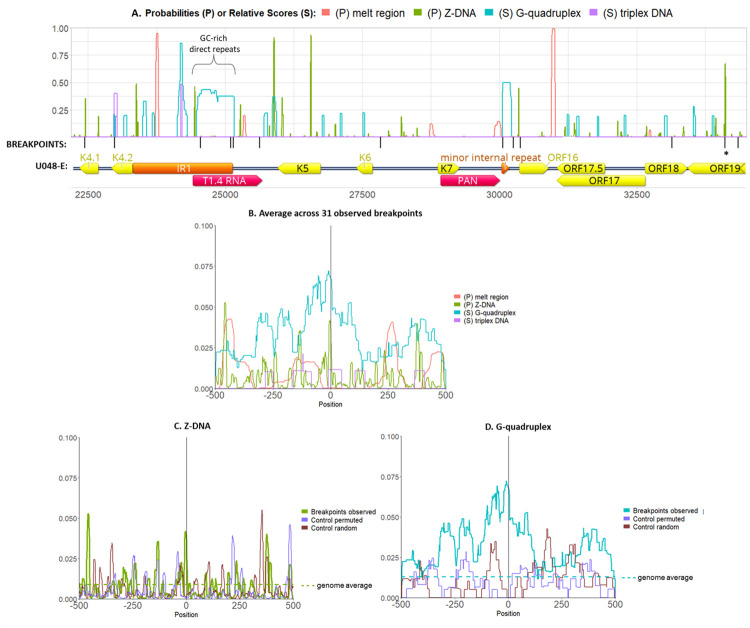
Fig 4. Association of breakpoints to non-B-DNA.
The probabilities and relative scores of 4 non-B-DNA structures (local melt region, Z-DNA, G-quadruplex and triplex DNA) were graphed along the genome of KSHV isolate U048-E. Shown is a genome segment including the overrepresented region including K5 and K6. The black ticks mark the breakpoints observed, and below are the annotations for ORFs (yellow), repeat regions (orange) and long non-coding RNAs (red). The asterisk at ORF19 denotes 2 breakpoints 3 bp apart found in 2 different individuals. G-quadruplex scores were normalized to 300, near the human genome maximum (https://pqsfinder.fi.muni.cz/genomes), and triplex scores were normalized to 50, the maximum found. (B.) Probabilities or relative scores were plotted in DNA sequences +/- 500 bp of 31 observed breakpoints (not including those at TR) and averaged across all windows. Score normalizations are as in panel A. Of note, all averages were below 0.10 since probabilities and scores were 0 within most breakpoint windows. (C.) Z-DNA probabilities and (D.) G-quadruplex scores in control permuted sequences and 31 control random windows. The genome-wide averages are shown with the horizontal broken lines.

