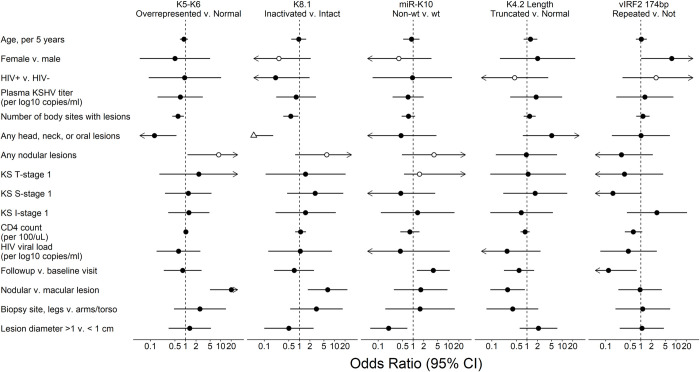
Fig 8. Associations between observed KSHV mutations and clinical traits.
Forest Plot of the odds ratio (OR) of participant and tumor characteristics with KSHV mutations from regression analysis of KS tumors from 29 participants, univariable analysis. Filled symbols were estimated with logistic regression and hollow symbols with exact logistic regression. Triangle indicates the OR point estimate is outside of the plotted range. Arrows indicate that the plotted range extends beyond the scale bar below.

