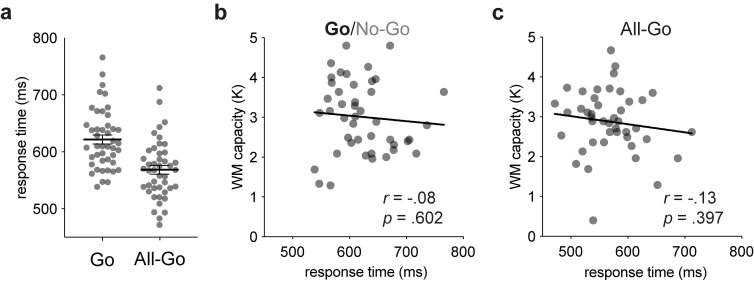
Fig 4. RT results from Experiments 1 and 2.
The underlying data supporting this figure can be found at https://osf.io/4wdzq. (a) Mean RTs for correct singleton-present trials of Experiments 1 (Go trials) and 2 (All-Go trials). Each dot represents a participant’s mean RT, and each horizontal line with SEM bars shows the grand-averaged RT. (b) Bivariate plot with WM capacity in Experiment 1. (c) Bivariate plot with WM capacity in Experiment 2. RT, response time; WM, working memory.

