
FIGURE 2.
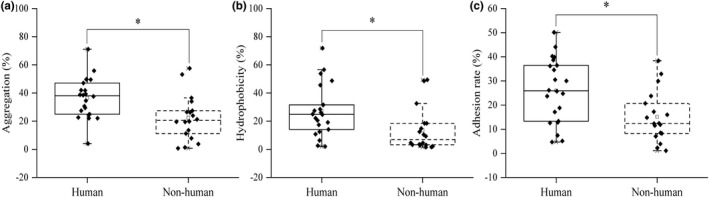
Comparison of the adhesion ability of strains from different sources. a: Aggregation. b: Hydrophobicity. c: Adhesion ability. All the data were tested three times and averaged. * represents significance (p < .05).
Official websites use .gov
A
.gov website belongs to an official
government organization in the United States.
Secure .gov websites use HTTPS
A lock (
) or https:// means you've safely
connected to the .gov website. Share sensitive
information only on official, secure websites.
Comparison of the adhesion ability of strains from different sources. a: Aggregation. b: Hydrophobicity. c: Adhesion ability. All the data were tested three times and averaged. * represents significance (p < .05).