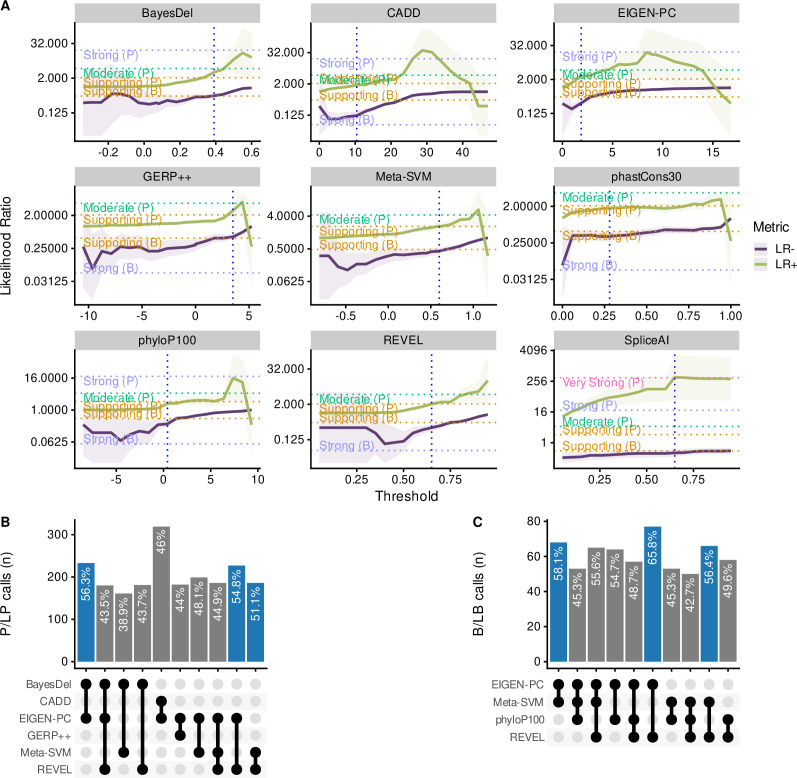
Figure 5. Comparison of the top performing in silico tools.
(A) Likelihood ratios of the top performing in silico tools with variable threshold. Vertical dashed lines indicate the optimal threshold based on the highest Matthews correlation coefficient (MCC). (B) Concordant pathogenic/likely pathogenic (P/LP) calls by any given combination of in silico tools (among top performing tools) for pathogenic variants. (C) Concordant benign/likely benign (B/LB) calls by any given combination of in silico tools (among top performing tools) for benign variants. For Panels B and C, the concordance rate (i.e., variant assertion for all tools in the combination matches the expert annotation) is provided as text annotation on the bar chart. Only the first top 10 tool combinations based on concordance rate are shown, with the top three shown in blue.


