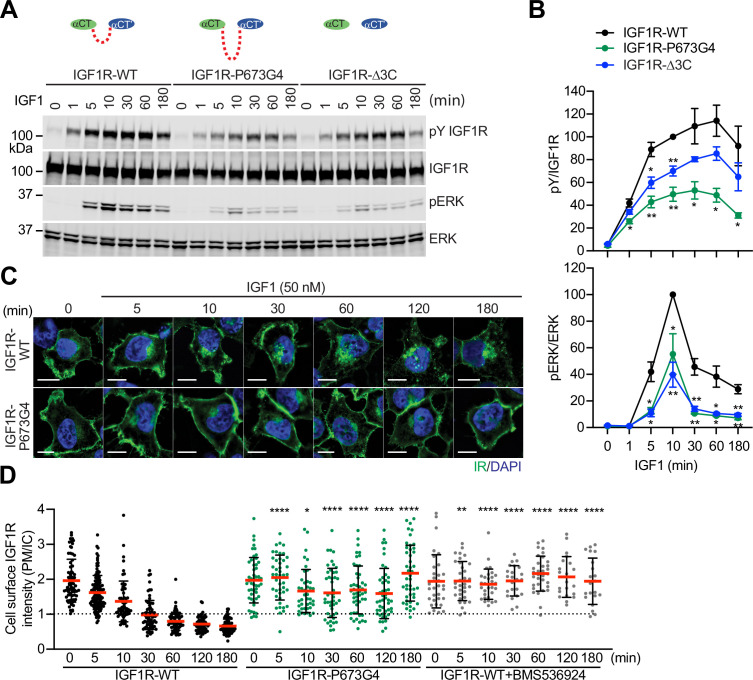
Figure 3. Functional importance of disulfide-linked αCTs on the IGF1R activation.
(A) IGF1-induced IGF1R autophosphorylation and pERK levels in 293 FT cells expressing IGF1R wild-type (WT), IGF1R-P673G4, and IGF1R-Δ3C. Cells were treated with 50 nM IGF1 for the indicated times. Cell lysates were blotted with the indicated antibodies. Source data are presented in Figure 3—source data 1. (B) Quantification of the western blot data shown in A (Mean ± SEM, N=3). Significance calculated using two-tailed student t-test; *p<0.05 and **p<0.01. Source data are presented in Figure 3—source data 2. (C) HeLa cells expressing IGF1R-GFP WT or IGF1R-GFP P673G4 were starved, treated with 50 nM IGF1 for indicated times, and stained with anti-GFP (IGF1R, green) and DAPI (blue). 2 μM BMS536924 were treated for 2 hr prior to IGF1 stimulation. Scale bar, 10 μm. (D) Quantification of the ratios of plasma membrane (PM) and intracellular (IC) IGF1R-GFP signals of cells in C (IGF1R WT0, n=72; WT5, n=118; WT10, n=62; WT30, n=71; WT60, n=71; WT120, n=69; WT180, n=67; P673G4-0, n=50; P673G4-5, n=44; P673G4-10, n=42; P673G4-30, n=46; P673G4-60, n=48; P673G4-120, n=47; P673G4-180, n=45; WT +BMS0, n=32; WT +BMS5, n=33; WT +BMS10, n=31; WT +BMS30, n=23; WT +BMS60, n=33; WT +BMS120, n=21; WT +BMS180, n=21). Mean ± SD; two-tailed student t-test; *p<0.05; **p<0.01; ****p<0.0001. Source data are presented in Figure 3—source data 2.

