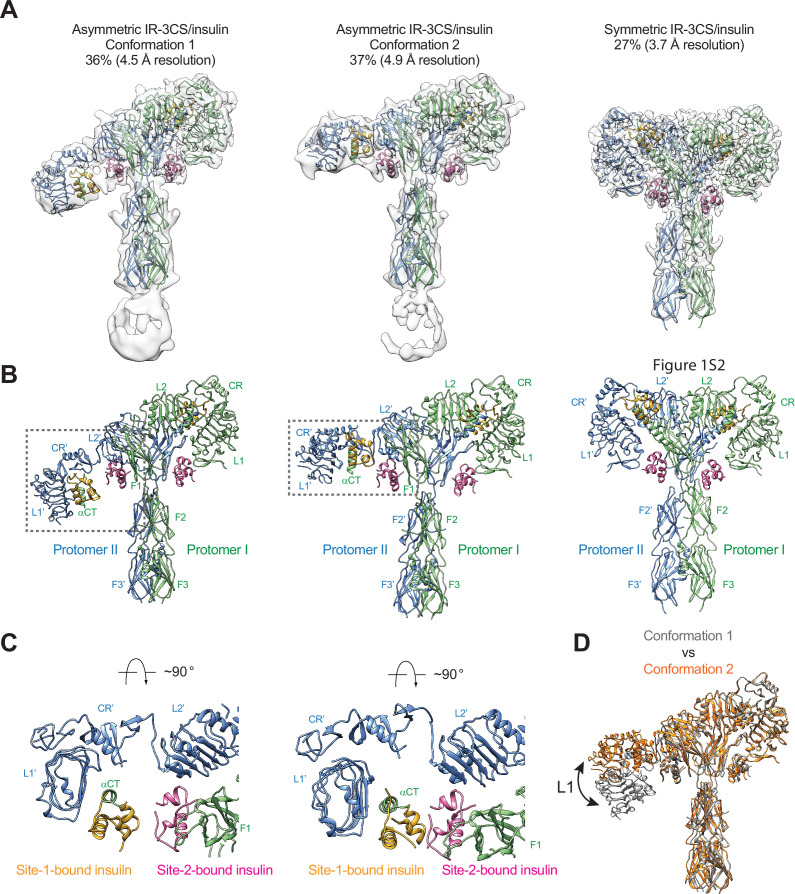
Figure 4. Structures of IR-3CS with insulin bound.
(A) 3D reconstructions of the 2:4 IR-3CS/insulin complexes in both asymmetric and symmetric conformations, and the corresponding ribbon representation. The asymmetric conformations 1 and 2 were fitted into cryo-EM at 4.5 Å and 4.9 Å resolution, respectively. The symmetric conformation was fitted into cryo-EM at 3.7 Å resolution. The asymmetric conformations 1 and 2 were reconstructed from 36% and 37% of the well-defined particles, respectively. The symmetric conformation was reconstructed from 27% of the well-defined particles. (B) Ribbon representations of the asymmetric and symmetric IR-3CS/insulin complexes. (C) Top view of the asymmetric IR-3CS/insulin complexes. The location of this interaction in the asymmetric dimer is indicated by gray boxes in B. (D) Superposition between the asymmetric conformations 1 (gray) and 2 (orange), revealing conformational change of the L1/CR domains (indicated by the arrow).


