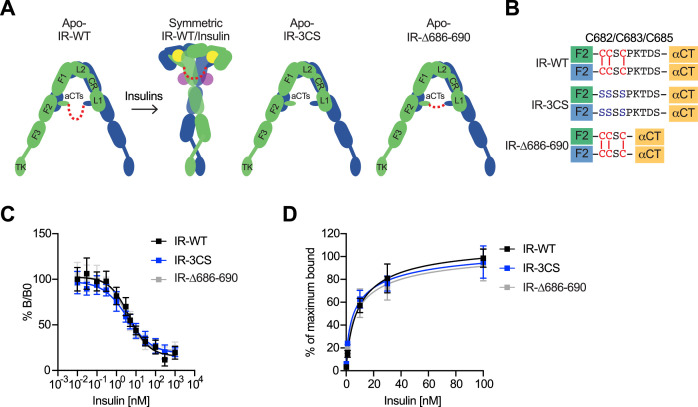
Figure 5. The function of disulfide-linked αCTs in the binding of insulin to IR.
(A) Cartoon representations of the apo-IR, IR/insulin complex showing the IR dimer bound with four insulins (left), apo-IR-3CS (middle) and apo-IRΔ686–690 (right). The two IR protomers are colored in green and blue; the insulins at site-1 and site-2 are colored in yellow and purple, respectively. The linker between two αCTs is shown as red dotted line. (B) Sequences of the linker between two αCTs in the IR-WT, IR-3CS, and IR-Δ686–690 showing disulfide bonds in red. (C) Insulin competition-binding assay for full-length IR-WT, IR-3CS, and IR-Δ686–690. Mean ± SD. IR-WT, n=15 (IC50=4.260 ± 0.9109 nM, Mean ± SD); IR-3CS, n=12 (IC50=3.306 ± 0.4619 nM); IR-Δ686–690, n=12 (IC50=3.231 ± 0.06734 nM). Source data are presented in Figure 5—source data 1. (D) Binding of insulin labeled with Alexa Fluor 488 to purified IR-WT, IR-3CS, and IR-Δ686–690 in the indicated conditions. Mean ± SD. n=24. Source data are presented in Figure 5—source data 1.

