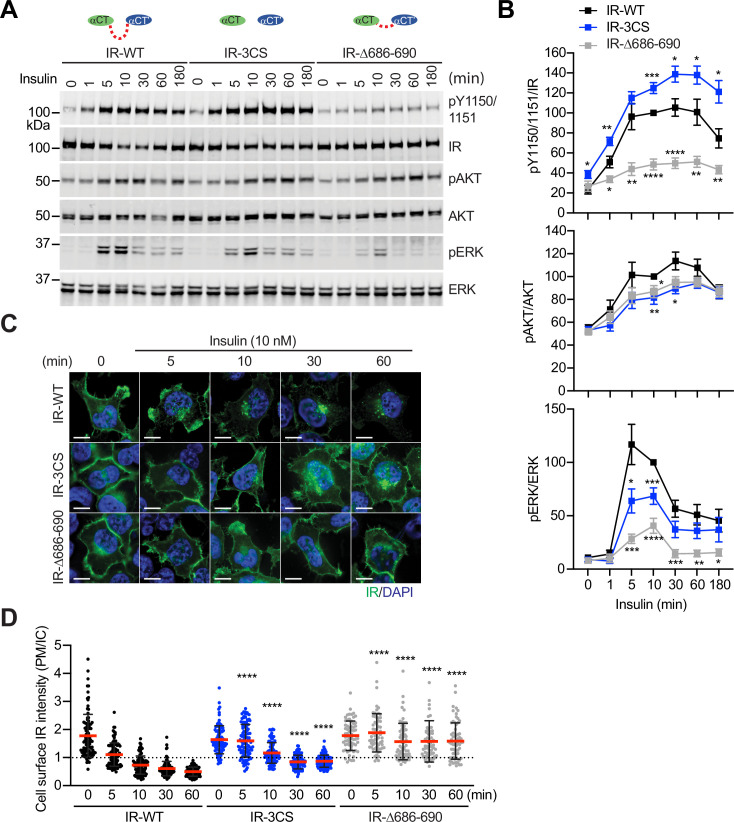
Figure 6. Functional importance of disulfide-linked αCTs on the IR activation.
(A) Insulin-induced IR autophosphorylation, pAKT, and pERK levels in 293 FT cells expressing IR wild-type (WT), IR-3CS, and IR-Δ686–690. Cells were treated with 10 nM insulin for the indicated times. Cell lysates were blotted with the indicated antibodies. Source data are presented in Figure 6—source data 1. (B) Quantification of the western blot data shown in A (Mean ± SEM, pY IR/IR, WT, n=7; 3CS, n=13; Δ686–690, n=8; pAKT/AKT, WT, n=5; 3CS, n=7; Δ686–690, n=6; pERK/ERK, WT, n=7; 3CS, n=12; Δ686–690, n=9). Significance calculated using two-tailed student t-test; *p<0.05; **p<0.01; ***p<0.001; ****p<0.0001. Source data are presented in Figure 6—source data 2. (C) HeLa cells expressing IR-GFP WT, IR-GFP 3CS, or IR-GFP Δ686–690 were starved, treated with 10 nM insulin for indicated times, and stained with anti-GFP (IGF1R, green) and DAPI (blue). Scale bar, 10 μm. (D) Quantification of the ratios of plasma membrane (PM) and intracellular (IC) IGF1R-GFP signals of cells in C (WT0, n=97; WT5, n=102; WT10, n=98; WT30, n=88; WT60, n=103; 3CS0, n=88; 3CS5, n=98; 3CS10, n=92; 3CS30, n=93; 3CS60, n=94; Δ686-690-0, n=65; Δ686-690-5, n=63; Δ686-690-10, n=66; Δ686-690-30, n=64; Δ686-690-60, n=69). Mean ± SD; two-tailed student t-test; ****p<0.0001. Source data are presented in Figure 6—source data 2.


