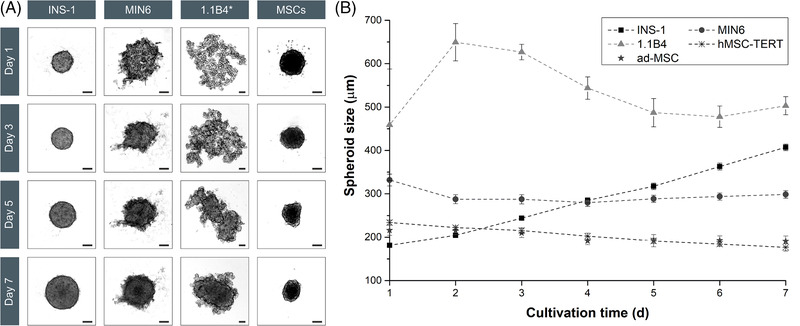
FIGURE 1.

Images of the spheroids from static culture for morphological analysis and the determination of properties such as spheroid size and circularity (n = 12; data are means ± STDV). (A) Morphological differences can be seen during the aggregation of the different β‐cell lines within 7 days. The images of INS‐1, MIN6, and MSCs were reduced by 60%, whereas the 1.1B4 images were reduced by 73% (*). In both cases the scale bar represents 100 μm. (B) The growth kinetics of the spheroids reveal the differences between cell lines. The INS‐1 cells (squares) showed fast aggregation and a continuous increase in spheroid size, whereas the MIN6 cells (circles) needed 3 days to form stable spheroids before slow growth was observed. The 1.1B4 cells (triangles) aggregated slowly over 5–7 days, represented by a peak on day 2 followed by a decline in size until a stable spheroid was formed and a volume increase was observed. The hMSC‐TERTs (crosses) and ad‐MSCs (stars) showed no growth and the spheroid size declined over time. 1.1B4, a cell line formed by the electrofusion of primary human pancreatic islets and PANC‐1 cells; hMSC‐TERT, human mesenchymal stromal/stem cells immortalized with reverse transcriptase telomerase; INS‐1, rat insulinoma‐1 cell line; MIN6, mouse insulinoma‐6 cell line; MSC, mesenchymal stromal/stem cell; STDV, standard deviations
