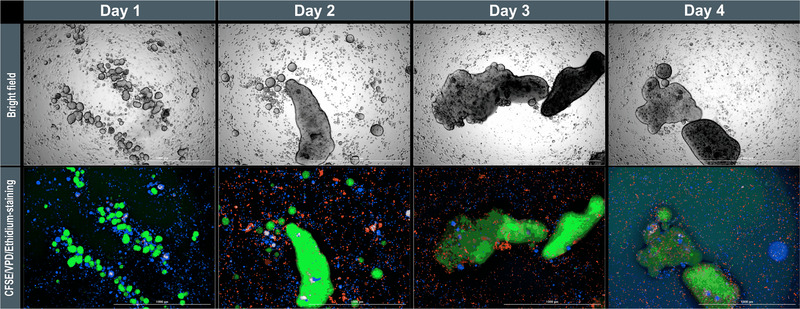
FIGURE 6.

Coculture of INS‐1 cells and hMSC‐TERTs in shaking flasks with a 1:1 ratio. INS‐1 cells were stained with CFSE (green), hMSC‐TERTs with VPD (blue), and dead cells with ethidium (red). The long‐term dyes are diluted by cell division, so the images were overexposed from day 3 onwards to distinguish the cells. Scale bar = 1000 μm. CFSE, 5‐(and 6)‐carboxyfluorescein diacetate, succinimidyl ester; hMSC‐TERT, human mesenchymal stromal/stem cells immortalized with reverse transcriptase telomerase; INS‐1, rat insulinoma‐1 cell line
