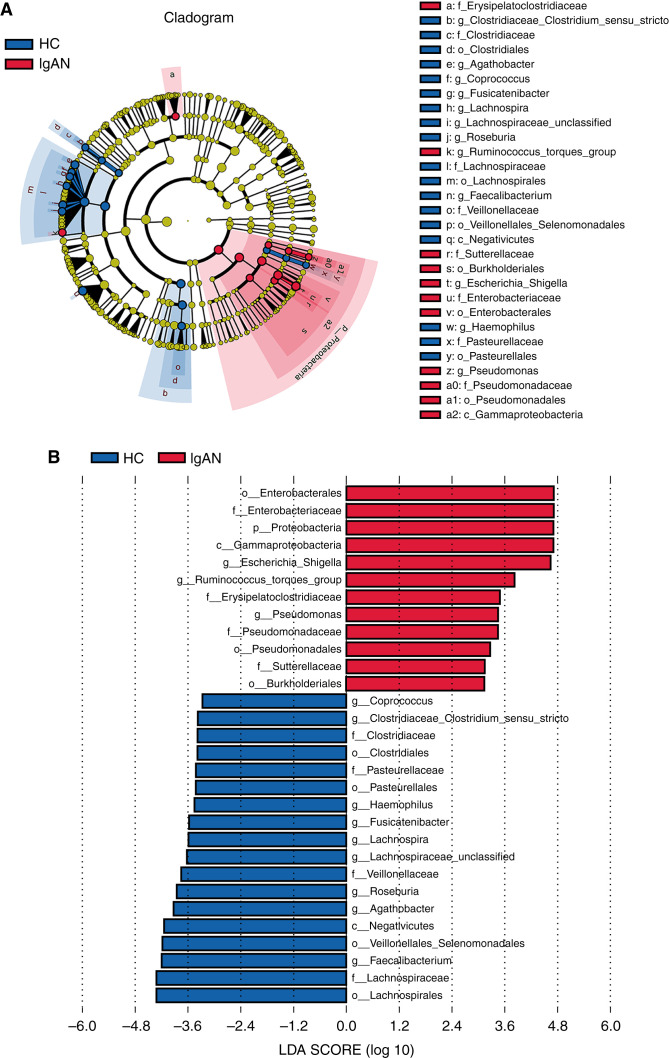
Figure 4.
Crucial taxa that contribute to the difference between patients with IgAN and HCs on the basis of LDA effect size analysis (discovery set; 84 patients with IgAN, 84 HCs). (A) Cladogram shows crucial bacteria with an evolutionary relationship associated with IgAN on the basis of the LDA selection (LDA>3). Each circle represents a classification level from phylum to species, from the inner to outer circles. The size of each circle is proportional to relative abundance. Microbes with no significant difference in abundance are shown in brown. Taxa with an LDA value greater than three in the IgAN and HC groups are marked with red and green, respectively. (B) Bar chart shows crucial bacteria associated with IgAN on the basis of the LDA selection (LDA>3). Red bars represent taxa enriched in those with IgAN, and green bars represent taxa enriched in HCs. p, phylum; c, class; o, order; f, family; g, genus.

