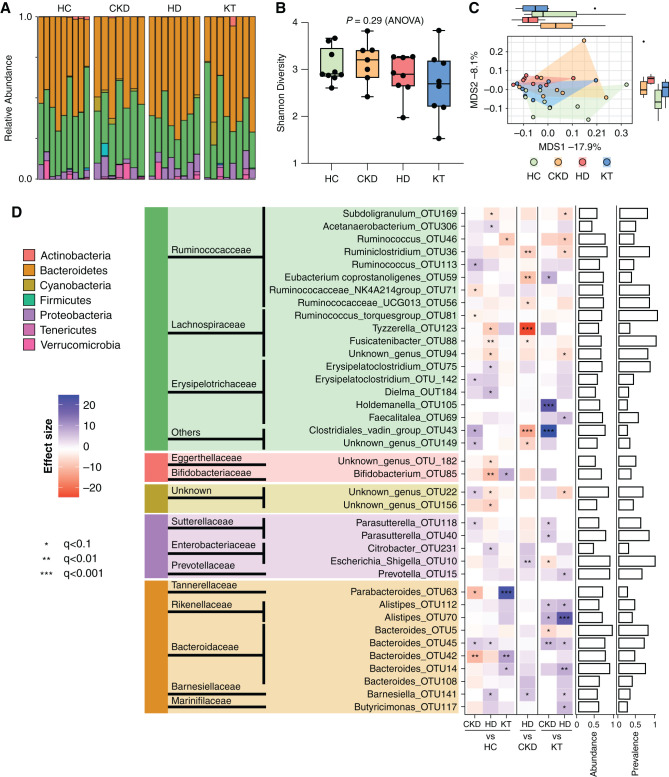
Figure 2.
Taxonomic changes of the gut microbiome are most pronounced in HD patients. Analysis of gut microbiota from 16S ribosomal RNA sequencing in children (n=32) with CKD (CKD G3–4), patients with HD, patients after KT, and HCs. (A) Relative abundance on the phylum level of individuals according to their respective group. (B) α-Diversity as measured by Shannon diversity. Data are shown as a box (median and interquartile range) and whiskers (minimum–maximum) with overlaid dot plot. (C) β-Diversity assessment by principal coordinate analysis on the basis of Canberra distance (P=0.01 by PERMANOVA). (D) Analyses of group differences on the OTU level are shown as a heatmap, and their phylogenetic origin is visualized on the genus, family, and phylum level. Patient groups were tested against each other (pairwise). The heatmap shows significant changes in abundance using the DESeq2 version 1.30.1 package. Multiple groups of the same genus reported by Lotus due to a lack of coverage in available phylogenetic databases are marked by numbers. Bar charts (right) show abundance and prevalence; abundance is calculated as log(genus count)/log(maximum[genus count]); prevalence for each genus is calculated across the whole dataset. All significance estimates were adjusted for multiple tests using BH-FDR correction. MDS, multidimensional scaling. *q<0.1, **q<0.01, ***q<0.001.

