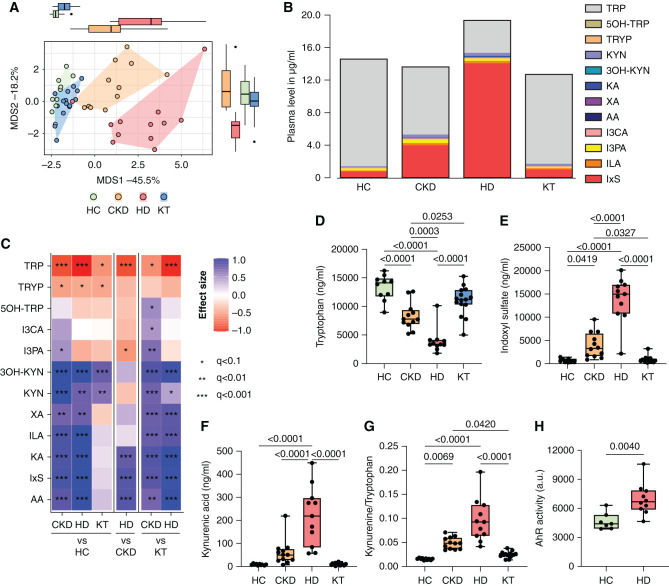
Figure 3.
Stage-dependent activation of plasma TRP metabolism activates the AhR. TRP and its metabolites were measured in plasma of children at different stages of CKD compared with HCs (n=48). (A) Multivariate analysis (principal coordinate analysis) of all measured metabolites discriminates between patients with CKD G3–4, patients on HD, patients after KT, and HCs. (B) Cumulative load of TRP and its metabolites. (C) Univariate analysis, depicted as a heatmap, shows effect sizes (Cliff δ) for each pair of patient groups. Colors denote the effect directions (blue, positive; red, negative) and magnitudes (the darker the color, the stronger the magnitude); asterisks represent the association significance. Statistical significance was assessed by MWU test and BH-FDR correction. Group differences of (D) TRP, (E) IxS, and (F) kynurenic acid (KA) were further visualized in box plots. (G) The KYN/TRP ratio indicates the activity of TRP degradation to KYN metabolites. (H) The activity of the AhR was analyzed using a transfected reporter cell line after 48 hours of incubation with serum of HCs (n=7) and patients on HD (n=10). P≤0.05 is shown, as measured by ordinary one-way ANOVA or Kruskal–Wallis test and adjusted by post hoc Tukey or Dunn correction for multiple testing (D–G) or by t test (H). Data are shown as a box (median and interquartile range) and whiskers (minimum–maximum) with overlaid dot plot. AA, anthranilic acid; I3CA, indole-3-carboxyaldehyde; ILA, indole lactate; MDS, multidimensional scaling; I3PA, indole-3-propionic acid; 3OH-KYN, 3-hydroxykynurenine; 5OH-TRP, 5-hydroxytryptophan; TRYP, tryptamin; XA, xanthurenic acid. *q<0.1, **q<0.01, ***q<0.001.

