Figure 1.
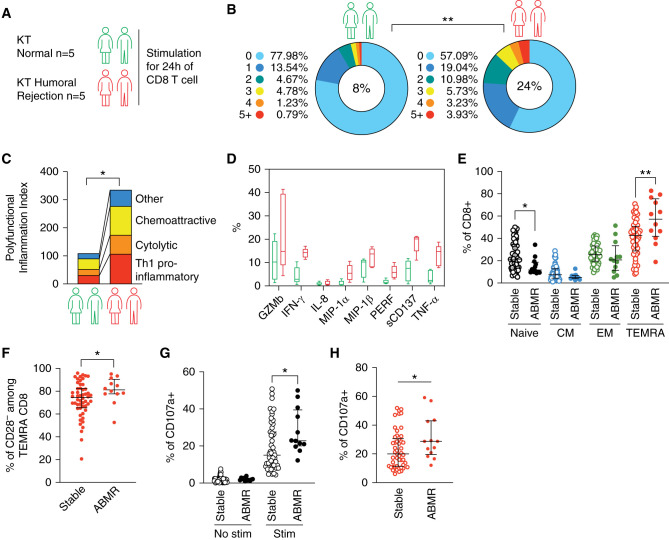
KTs with biopsy-proven ABMR showed an expansion of TEMRA CD8. (A) CD8 T cells from KTs with humoral rejection (n=5) or with normal histologic biopsy (n=5) stimulated O/N with anti-CD3 and anti-CD28 mAbs prior to single-cell cytokines analysis using single-cell 32-plex profiling. (B) The frequency of polyfunctional CD8 T cells is shown per number of cytokines produced as well as the mean overall polyfunctional CD8 T cells (i.e., producing two or more cytokines) inside the pie chart. (C and D) PSI defined as the percentage of polyfunctional T cells (two or more cytokines secreted) in the sample multiplied by the mean fluorescence signal intensity of the proteins secreted by those cells, and the contribution of each analyte to the PSI is shown. (E–H) KTs were recruited 1 year after their transplantation and with either biopsy-proven ABMR (n=12) or normal histologic biopsy (n=52; recipient age and sex matched). (E) Frequency of functional subsets among CD8 T cells. (F) Percentage of CD28– among TEMRA CD8. (G and H) Cytotoxic response of (G) CD8 T cells or (H) TEMRA CD8 after 4 hours of ex vivo stimulation with CD3 (2 μg/ml) and IL-15 (10 ng/ml). Data represent the median ± interquartile range (25%–75%) and the value (point) of a single patient and one representative patient. The P values were calculated using the Mann–Whitney U test. *P=0.05; **P=0.01. CM, central memory; Stim, stimulation; ABMR, antibody-mediated rejection.

