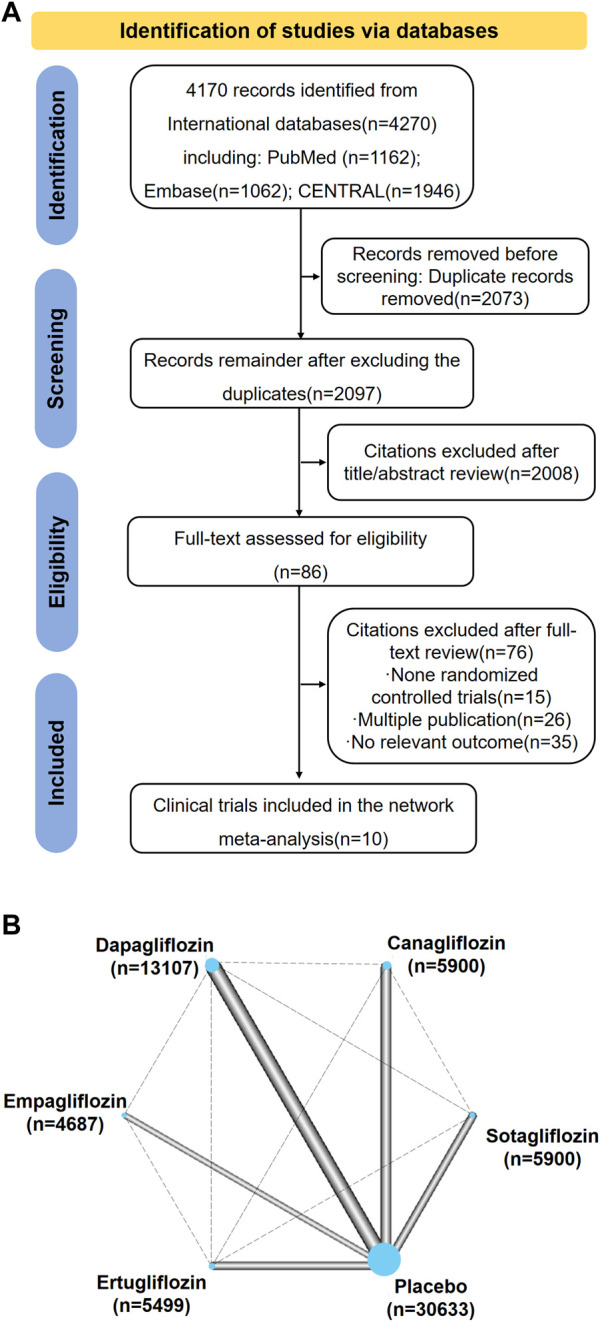
FIGURE 1.

(A) Summary of Study Identification for Network Meta-analyses. (B) Network Plot for All Studies. Graphical representation of network for all induced trials. Connecting solid lines represent head-to-head comparisons between drugs, indicated by nodes. The thickness of lines between nodes is proportional to the number of trials comparing the treatments. The sizes of the nodes are proportional to the number of patients in each treatment which is marked below drugs. The control group is compared with each drug class. This is accounted for within the network model and does not constitute duplication of participants.
