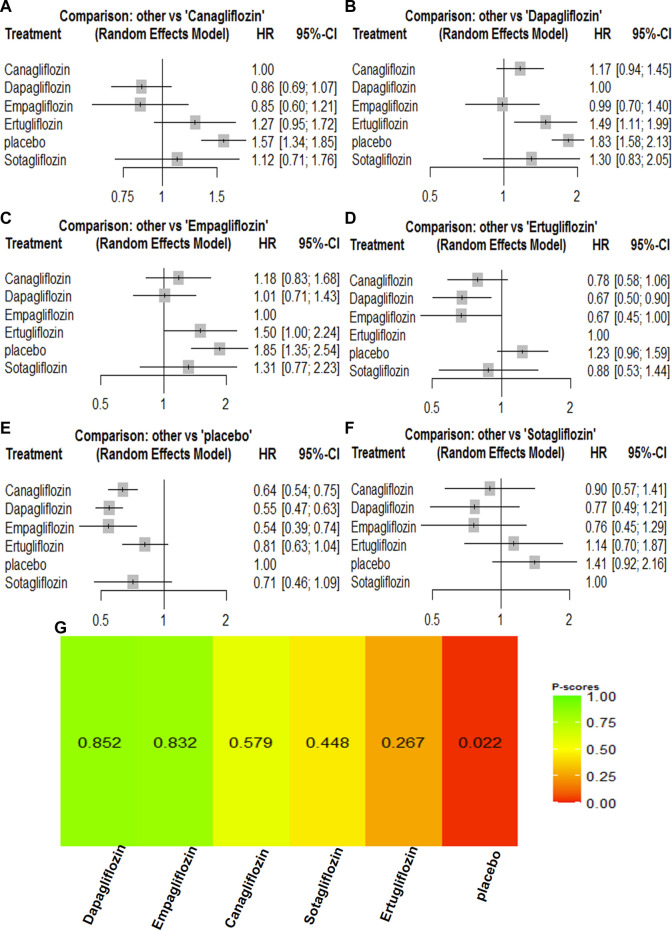
FIGURE 5.
Forest Plots and Ranking Plots of Network Meta-analysis of all trials for Composite Renal Outcome. (A) Forest Plots of other drugs compare to canagliflozin. (B) Forest Plots of other drugs compare to dapagliflozin. (C) Forest Plots of other drugs compare to empagliflozin. (D) Forest Plots of other drugs compare to ertugliflozin. (E) Forest Plots of other drugs compare to placebo. (F) Forest Plots of other drugs compare to sotagliflozin. All effect estimates are expressed as hazard ratios (HRs) for treatment vs the comparator and 95% credible intervals (95%-CI). For example, the HRs in composite renal outcome for dapagliflozin compared to canagliflozin is 0.86 (95%-CI 0.69 to 1.07). The x-axis scale indicates the range of the HRs. (G) Ranking Plots of Network Meta-analysis. Plots below the forest plots show for the rank of each drug class and ranking descending from left to right, The p-score represents the power of the ranking.

