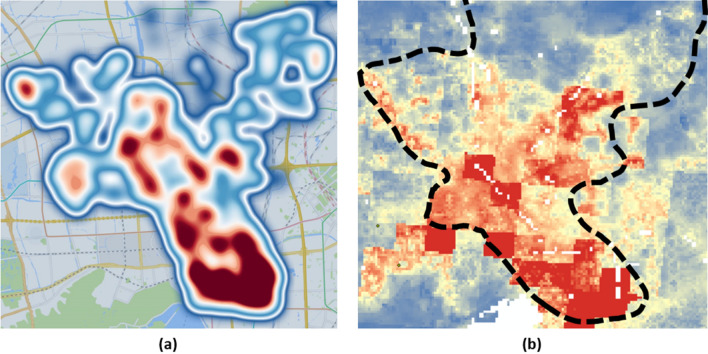
Figure 5.
Comparing the starting point of our results with high-precision population density dataset published by Worldpop. (a) is the heat map based on the starting point of the trajectory we generated (created by Gaode Map JS API, version 2.0, https://lbs.amap.com/api/jsapi-v2/summary). (b) is the heat map based on the population density dataset published by Worldpop. We have marked the area we generated with black dashed lines e.

