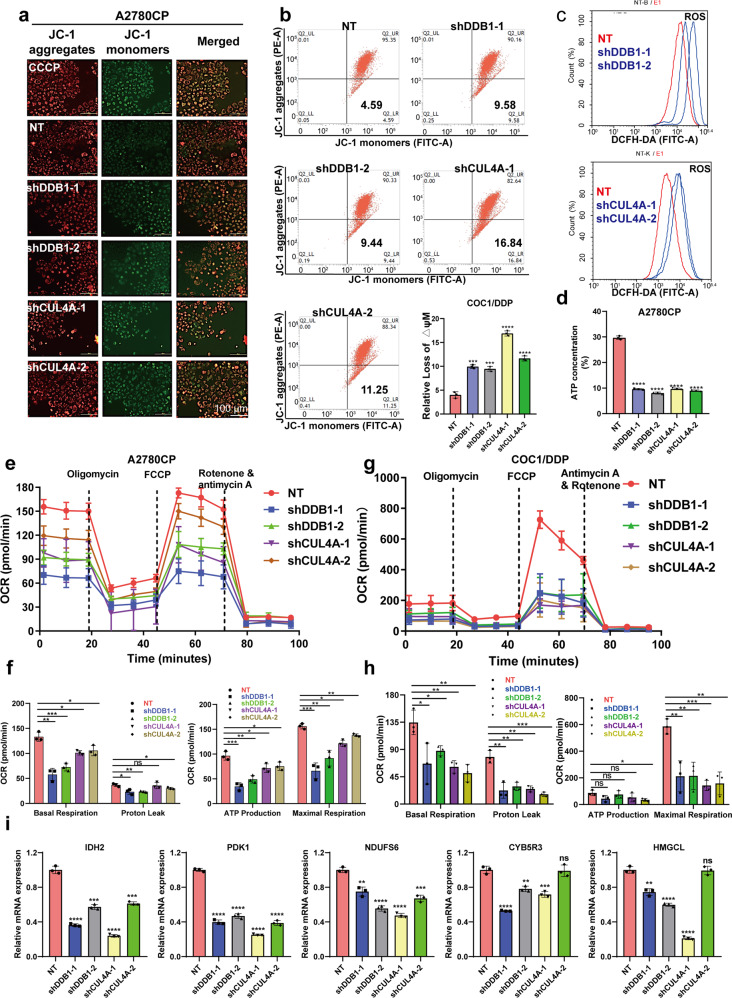
Fig. 2.
Knocking down CRL4CUL4A/DDB1 significantly impaired the mitochondrial function of cisplatin-resistant OCCs. a Mitochondrial membrane potential in A2780CP cells determined with JC-1 probe after CRL4CUL4A/DDB1 knockdown. CCCP (Carbonyl cyanide 3-chlorophenylhydrazone) was used as a positive control. Normal mitochondrial membrane potential (MMP) is shown in red with JC-1 dimers (JC-1 aggregates) and depolarized membrane potential is shown in green in JC-1 monomers, where a fluorescent color change from red to green indicates a decrease of MMP. Scale Bar: 20 μm. b Mitochondrial membrane potential detected by flow cytometric analysis in intact cells treated as in (a) and the quantification. Normal mitochondrial membrane potential (MMP) is shown in JC-1 dimers (JC-1 aggregates) and depolarized membrane potential is shown in JC-1 monomers. Data represent mean ± SEM with three replicates, **p < 0.01, ***p < 0.001, ****p < 0.0001. c The ROS accumulation levels detected by DCAF probe using flow cytometry in A2780CP cells lacking CRL4CUL4A/DDB1. d The ATP level detected by multifunctional imaging enzyme labeling in A2780CP cells knocking down CRL4CUL4A/DDB1. e, g A representative graph of the oxygen consumption rate (OCR) throughout the mitochondrial-stress test using Seahorse XF24 analyzer in e A2780CP and g COC1/DDP CRL4-knockdown cells. Mitochondrial inhibitors were added to the media to assess respiratory parameters with indicated time. f, h Oxygen consumption rates (OCR) of basal respiration, proton leak, ATP production, and mitochondrial maximal respiration quantified from the mitochondrial-stress test are shown f A2780CP and h COC1/DDP CRL4-knockdown cells. Data were presented as the mean ± SEM Group differences are analyzed by the two-tailed Student’s t-test. i Transcriptional levels of TCA- and oxidative phosphorylation-associated enzymes based on RNA-seq data analysis

