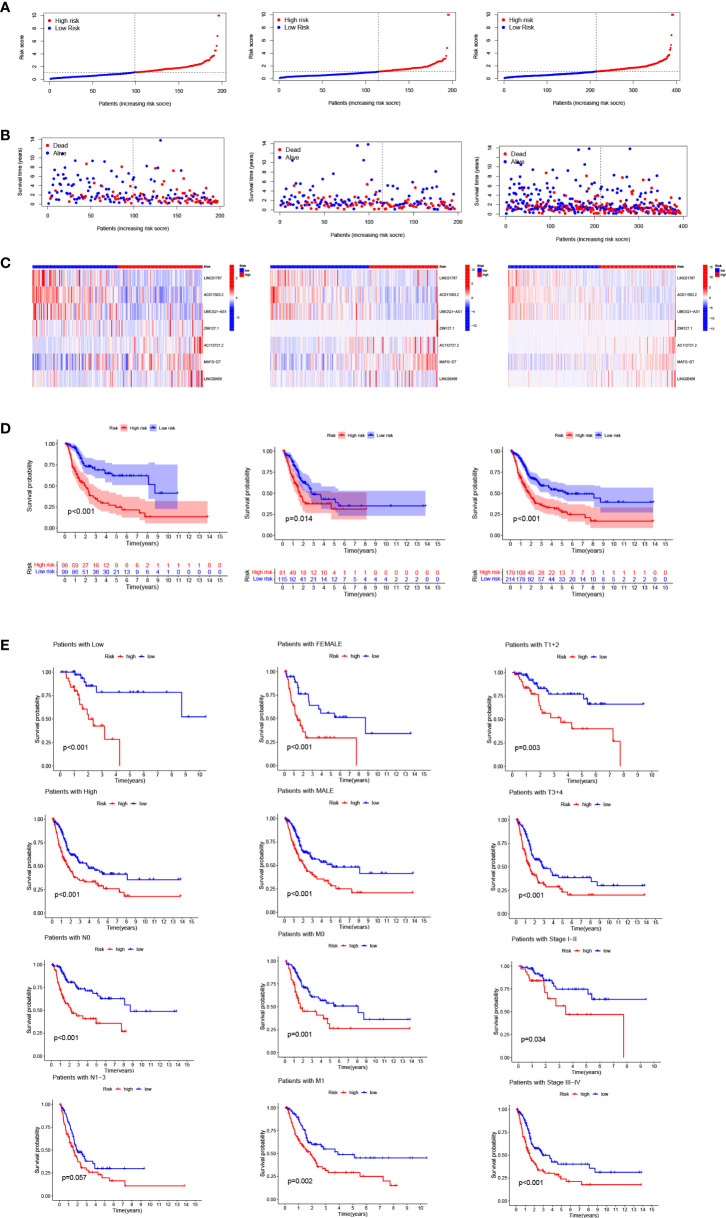
Figure 3.
Risk model prognosis in the train, test and entire sets: (A) Risk score distribution diagram of train, test and entire sets; (B) Heat map of seven prognosis-related arlncRNAs; (C) The heat map of 7 lncRNAs expression in the train, test, and entire sets, respectively. (D) Survival analysis of high- and low-risk patients in train, test, and entire sets; (E) Survival analysis of clinicopathologic characteristics of high- and low-risk patients in entire sets.

