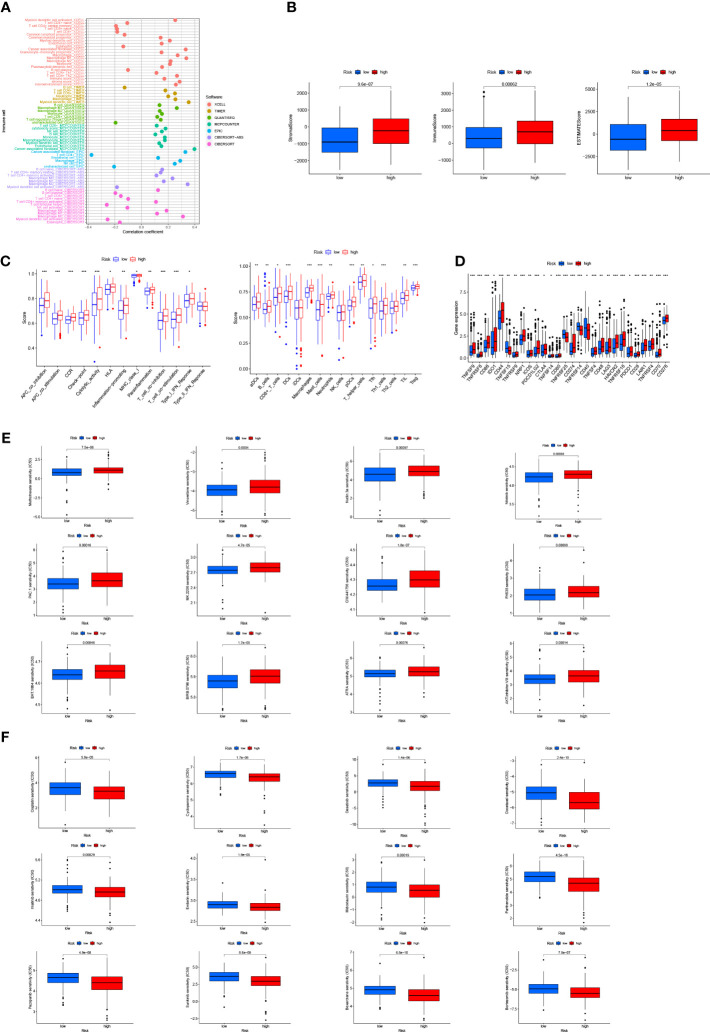
Figure 7.
Discussion on immune infiltration and immunotherapy for patients with bladder cancer: (A) Bubble chart for immune cell correlation analysis; (B) Differences in immune microenvironment scores of patients at high and low risks; (C) Boxplots of immune cells in high- and low-risk groups and immune-related pathway analysis; (D) Analysis of immune checkpoints of the two risk groups; (E, F) Analysis of patients’ sensitivity to drugs. ***p < 0.001, **p < 0.01, *p < 0.05.

