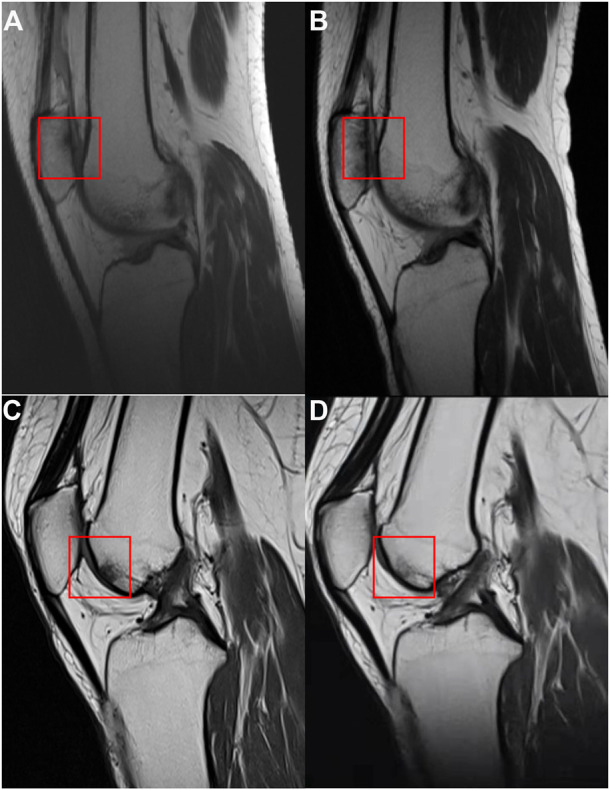
FIGURE 6.

The MRI of the case in two groups. (A) MRI of a case before injection in the hyaluronic acid group. (B) MRI of the case at the final follow-up in the hyaluronic acid group. (C) MRI of a case before injection in the platelet-rich plasma group. (D) MRI of the case at the final follow-up in the platelet-rich plasma group. The comparisons of bone marrow lesion were shown by the red square.
