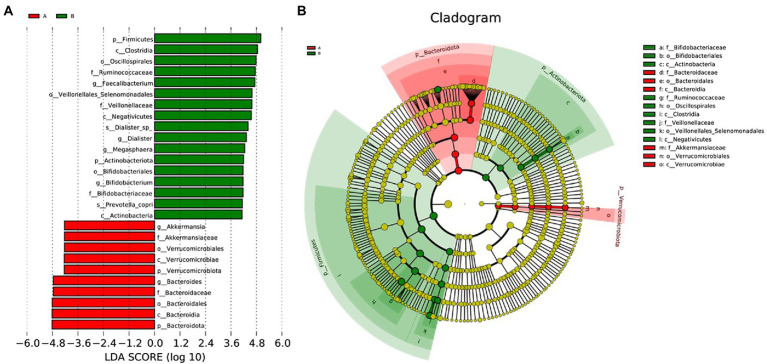
Figure 4.
LEfSe analysis. (A), Histogram of LDA Score distribution. The difference of species abundance between two groups. (B), Cladogram. The phylogenetic distribution of GMB associated with two groups. The circle radiating from inside out represents the rank of classification from phylum to species.

