

Abstract
A solid polymer electrolyte based on polyvinyl alcohol (PVA)/carboxymethyl cellulose (CMC)/polyethylene 3,4-dioxythiophene: sodium polystyrene sulfonate (PEDOT:PSS) has been prepared with various concentrations of incorporated silver (Ag) nanoparticles (NPs) by using solution cast approach. The FTIR spectroscopic study revealed the complexation between the polymeric nanocomposite (PNC) and the Ag NPs. The X-ray diffraction (XRD) results infer that the semicrystalline phase of PNC decreases as the amount of incorporated Ag NPs increases. The transmission electron microscope (TEM) image revealed that Ag NPs have diameters ranging from 22 to 43 nm. Complex dielectric permittivity and alternating current (AC) electrical conductivity of nanocomposite films have been investigated in the frequency range from 0.1 Hz to 20 MHz at 30 °C. Dc conductivity () values for the nanocomposite films are estimated from AC conductivity plots. The value was observed to increase from 1.98 × 10⁻⁹ to 2.29 × 10⁻⁷ S.cm−1 for the PNC system incorporated with optimal Ag NPs. From complex impedance (Z*) analysis, it has been found that the bulk electrical resistance (Rb) of the PNC films decreases with increasing the Ag NPs content. Therefore, these obtained PNC films have promising applications in energy storage devices.
Subject terms: Energy science and technology, Materials science, Physics
Introduction
In recent years, the development of solid polymer electrolyte (SPE) has made great advances in sensors, high energy density batteries, electrochromic displays and windows, and photovoltaic cells due to its flexibility, electrochemical stability, long life, and safety1,2. Polyvinyl alcohol (PVA) has interesting characteristics and a wide range of uses. It possesses high dielectric strength, strong charge storage capacity, high elasticity, and good film formation via solution casting3,4. It also contains hydroxyl side groups, which can interact with a variety of substances via physical or chemical action5. Furthermore, Carboxymethyl cellulose (CMC), available as sodium salt NaCMC is a polyelectrolyte smart cellulose derivative, non-toxic, biodegradable, and has a large number of carboxyl groups (–COOH)6. So, it can create a strong connection with PVA via hydrogen bonding and subsequent cross-linking7. The addition of CMC to the PVA matrix can enhance the polymer’s properties8. To impart higher conductivity to the polymer blend, conductive additives with dispersibility and good conductivity are required. A large number of π-conjugated polymers can transport electrons, so the addition of polypyrrole9–11, polyaniline12,13, poly (3,4-ethyldioxythiophene) polystyrene sulfonate (PEDOT:PSS)14,15 into the polymer blend to enhance its conductivity. Among these polymers, PEDOT:PSS has high electrical conductivity (), excellent electrochemical stability, and film-forming capabilities. In addition, PEDOT:PSS has also been used as electrocatalysts16, capacitors17,18, transistors19, solar cells20, and sensors21,22. To produce nanocomposites, nanoparticles (NPs) within the polymeric blend interact and create molecular bridges. Large polymeric/nanofiller interfacial regions are formed as a result of the uniform distribution and excellent dispersion of these NPs, which improve the materials’ electrical and dielectric characteristics23. Recently, several experiments have been performed to manufacture nanocomposite materials incorporating a variety of inorganic NPs, including zinc oxide (ZnO)24,25, copper (Cu)26, gold (Au)27, and silver (Ag)28, with different polymers. Among these inorganic NPs, Ag has the highest electrical conductivity (6.3× S.cm−1 at 20 °C) of any metal and is relatively inexpensive compared to other noble metals29.
In this work, SPE-based PNC films, PVA/CMC/PEDOT:PSS/various weights Ag NPs, were prepared. XRD, FTIR, and TEM were used to examine the structural properties of the produced nanocomposite films. Moreover, the impact of the Ag NPs content on the optical, electrical and dielectric properties of the prepared films has been investigated.
Experimental details
Materials
Polyvinyl alcohol (PVA, M.W. = 89,000–98,000, 99+% hydrolyzed), Poly(2,3-dihydrothieno-1,4-dioxin)-poly(styrene sulfonate) (PEDOT:PSS, 1.3 wt% dispersion in H2O), and carboxymethylcellulose (CMC, average M.W. = 250,000) were purchased from Sigma-Aldrich. Ag NPs (M.W. = 107.87) were purchased from Nanjing Chemical Reagent Co. Ltd. All the chemicals were analytically pure and used without purification.
Preparation of PVA/CMC/PEDOT: PSS/Ag NPs
Firstly, 1 g PVA and 0.5 g CMC were dissolved in 50 ml deionized water (DW) at 90 °C and 70 °C respectively, and then the two solutions were mixed and stirred for 3 h until completely dissolved. Secondly, five solutions of 10 ml of the above dissolved PVA/CMC and 0.3 ml of PEDOT:PSS in H2O were taken and mixed under stirring for 1h, and then 0, 1, 3, 5, 7 mg Ag NPs dispersed in 0.5 ml DW were added and continued to stir for 1 h, respectively. Finally, the resulting solutions were poured into polystyrene Petri dishes and evaporated at 50 °C. The as-prepared films with a thickness of 10–20 microns were labeled PCPP0, PCPP1, PCPP2, PCPP3, and PCPP4 based on the amount of Ag NPs added gradually.
Characterization
X-ray diffraction (XRD) patterns of the nanocomposite films were recorded at room temperature using DIANO corporation USA with CuKα radiation in the Bragg angle 2θ = 5°–70°. Fourier transform infrared (FTIR 430-JASCO, Japan) spectrometer measurements were recorded within the 400–4000 cm−1 range. The optical absorptions of the films were obtained using a UV–visible spectrophotometer (JASCO V-630-Japan) at λ = 190–900 nm. The size of Ag NPs was investigated by transmission electron microscope (TEM, JEOL/ JEM/1011, Japan). The scanning electron microscope (SEM, JEOL-JSM 6510/LV/250, U.S.A., at magnification 6,000X) was used to investigate the surface topography. Impedance and dielectric characteristics of the PNC films were carried out in the 10−1 Hz–10 MHz range at room temperature (305 K) using broadband dielectric spectroscopy (Novo control Turnkey Concept 40 System).
Results and discussion
FT-IR analysis
Fourier-transformed infrared (FTIR) spectroscopy was used to investigate the chemical structure of solid films. Figure 1a shows the FTIR spectra of PVA, CMC, and PEDOT:PSS. According to the FTIR spectrum of pure PVA, there is a wide characteristic peak observed at 3450 cm−1 assigned to the stretching vibration of intermolecular and intramolecular –OH bonds. The peaks at 2936 and 1725 cm−1 pertain to the stretching vibration of C–H and carbonyl C=O groups, respectively30,31. Also, the noticed peaks at 1430 and 1375 cm−1 are assigned to the bending and wagging of CH2 vibrations, respectively32. However, peaks at 1250, and 850 cm−1 are due to the stretching vibration of C–O and C–C groups, respectively. The above-all peaks confirm the existence of PVA. The peaks at 2914, 1630, 1413, 1323, 710, and 607 cm−1 are all correlated to pure CMC33. For PEDOT:PSS, the peak around 3400 cm−1 is due to the O–H stretching, the peak at 1645 cm−1 is due to the bending of the C=C group, peaks at 1196 and 1034 cm−1 are due to the stretching of C–O–C bond, and peak at 809 cm−1 is attributed to C–S bonds in thiophene backbone34,35. The characteristic peaks of PVA, CMC, and PEDOT:PSS can be noticed from the PVA/CMC/PEDOT:PSS (PCPP0) nanocomposite film, and the results of various weights of incorporated Ag NPs into PCPP in Fig1b. The oxygen-containing functional group (SO3 –H+) of PEDOT:PSS can interact and cross-link with PVA/CMC via hydrogen bonding36,37. With the following Ag NPs incorporating process into PCPP, the broadening and decreasing in the peak intensity suggest the physical interaction occurred between them38.
Figure 1.
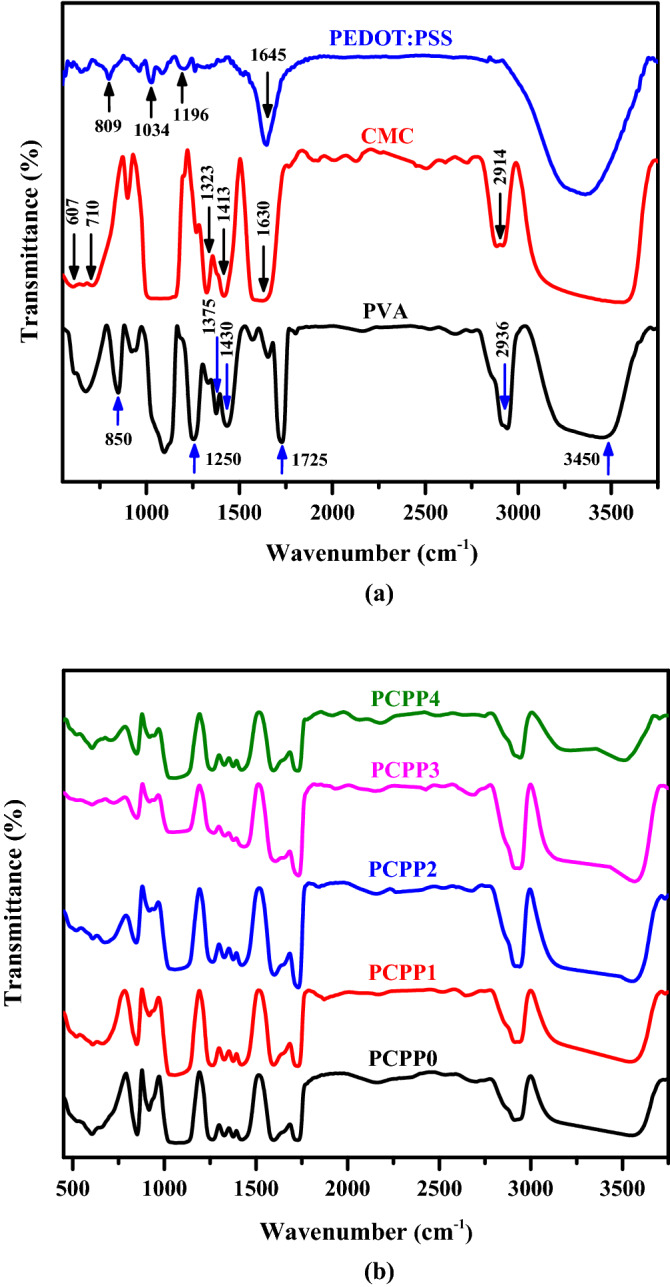
(a) FTIR spectra of PVA, CMC, PEDOT: PSS, and (b) PCPP with various Ag NPs weights films.
X-ray diffraction (XRD) analysis
Figure2 shows the XRD patterns for PCPP0, PCPP1, PCPP2, PCPP3, and PCPP4 from 5° to 70°, confirming the successful complexation between PVA, CMC, and PEDOT:PSS. It have been reported that PVA, CMC, and PEDOT:PSS have diffraction peaks lying at 2θ = 19.5°39, 2θ = 20.7°40 and 2θ = 25.6°41, respectively. It can be observed that the PCPP0 shows the existence of a semicrystalline phase with the diffraction peak centered at 2θ = 19.3°. This peak becomes more broadening and less intense as the Ag NPs increase which suggests the transference of PCPP from semicrystalline to amorphous structure. In addition, the higher weights of Ag NPs showed diffraction peaks at 2θ = 38°, 2θ = 44°, and 2θ = 64°, corresponding to (111), (200), and (220) lattice planes, respectively42.
Figure 2.
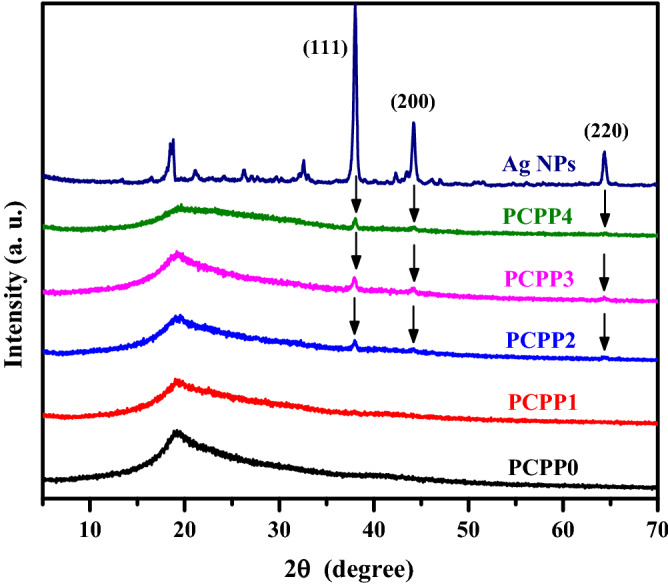
XRD spectra of PCMPP with various Ag NPs concentrations films.
Optical absorption study
The optical characteristics of the nanocomposite films (PCPP0 → 4) are investigated using a UV–vis spectrophotometer in the wavelength range 190–900 nm as shown in Fig. 3. An absorption band and hump are observed for all films at about 205 and 265 nm, respectively, which are ascribed to π-π* transition43. It is seen that there is an increase in the absorption peaks and is red-shifted with the increase of the incorporated Ag NPs. The optical energy bandgap (Eg) of the prepared films could be obtained from the absorption spectra using Tauc’s formula44:
| 1 |
where α is the absorption coefficient, β is a constant, and m is an empirical index of the transition modes. To calculate the direct optical energy gap () for the investigated films, the quantity (αhυ)2 is plotted as a function of photon energy (hυ) (Fig. 4a). For undoped film PCPP0, the optical energy gap was observed to be 5.16 eV while for incorporated films PCPP1 → 4, the values were 5.15, 5.12, 5.07, and 5.01 eV, respectively. On the other hand, the indirect optical energy gap () were calculated using (αhυ)1/2 versus (hυ) plots (Fig. 4b) and found to be 4.9 eV for PCPP0 and 4.85, 4.79, 4.64, and 4.44 eV for dopped films, respectively. The values of direct and indirect optical energy gaps are listed in Table 1. It is clear that the decrease in the values of and on doping PCPP with Ag NPs may be attributed to the formation of charge-transfer complexes45. In addition, the enhancement in the absorption coefficient of the PNC films may be related to the agglomeration of Ag NPs, which may scatter the light within the PNC samples46.
Figure 3.
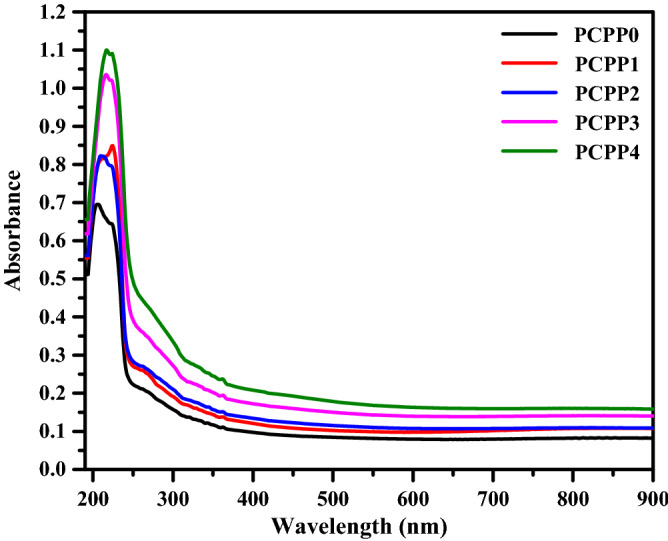
UV–vis absorption spectra of PVA/CMC/PEDOT: PSS with various weights of Ag NPs.
Figure 4.

(a) (αhυ)2 and (b) (αhυ)1/2 versus hυ of PVA/CMC/PEDOT: PSS with various weights of Ag NPs.
Table 1.
The extracted values of direct and indirect energy bandgap for PVA/CMC/PEDOT: PSS with various weights of Ag NPs.
| Films | (eV) | (eV) |
|---|---|---|
| PCPP0 | 5.16 | 4.9 |
| PCPP1 | 5.15 | 4.85 |
| PCPP2 | 5.12 | 4.79 |
| PCPP3 | 5.07 | 4.64 |
| PCPP4 | 5.01 | 4.44 |
Transmission electron microscope (TEM)
Figure 5 shows the TEM image of Ag NPs. It has a nearly spherical shape with sizes ranging from 22 to 43 nm.
Figure 5.
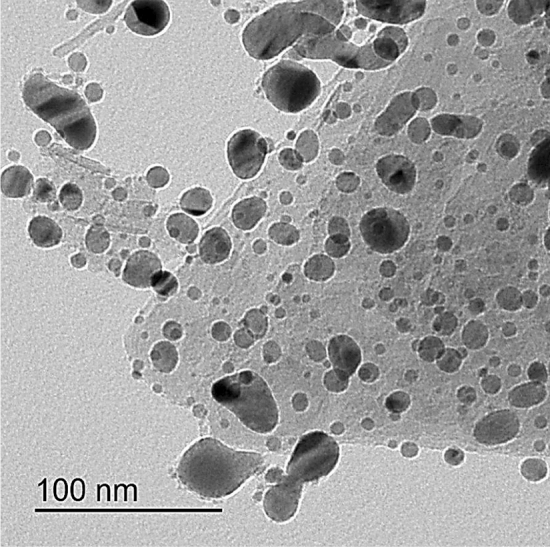
TEM images of Ag NPs.
Morphological studies
Scanning electron microscope (SEM) is a commonly used technique for identifying the formation and growth of agglomerated metallic NPs that leak to the surface of polymer nanocomposites47,48. Figure 6a–e show the surface morphology of PCPP films. From the top view of the PCPP0 nanocomposite film, the micrograph appeared to be smooth and promoted the good quality of the prepared films. When the Ag NPs content increased gradually, aggregated particles were formed, and their sizes increased. The consequences of the morphological alterations were revealed in the dielectric characteristics of the nanocomposite films and are described further below.
Figure 6.

SEM images of (a) PCPP0, (b) PCPP1, (c) PCPP2, (d) PCPP3, and (e) PCPP4 at magnification 6,000 times.
AC conductivity
Figure 7 shows the plot of AC conductivity as a function of frequency in the range of 0.1 Hz–20 MHz at room temperature. As noted, the behavior of increases nonlinearly with increasing frequency. This can be attributed to the hopping mechanism of charge carriers that acquires by providing the electrical field which in turn increases the relaxation frequency and so enhances the conductivity49. It is found that the frequency-dependent spectra of the nanocomposite films exhibit three distinguished regions; (i) the low-frequency dispersion region, which is related to the accumulation of charge (electrode polarization) at the electrode/polymer interface, (ii) the mid-frequency independent plateau region, which is attributed to DC conductivity , and (iii) high-frequency dispersion region which is attributed to short-range ion transport, which is caused by the charge carrier’s Coulomb interaction. So, the values of the films can be estimated using Jonscher’s power law50,51;
| 2 |
where A represents the frequency-independent pre-exponential constant, is the angular frequency (= 2 ), and m is the power-law exponent (0 ˂ m ˂ 1). The of the undoped and doped Ag NPs films has been calculated by intersecting extrapolated plateau region of - axis. It is noticed that the value increased from 1.98 × 10⁻⁹ to 7.41 × 10⁻⁸ S.cm−1 for PCPP0 and PCPP3 films, respectively. The increase in values of the nanocomposite films with the increase of dispersed Ag NPs contents indicates that there is either increase in charge carrier mobility or an increase in Ag ion carriers that contribute to the conductivity and polarization mechanisms. While the higher the content of Ag NPs in the PCPP4 film, the lower the value. This decrease may be attributed to the reduced Ag NPs which might act as grain boundaries and impede the Ag ion carriers to be transported through the polymeric matrices. Therefore, a few Ag ions participate in the conductivity and polarization.
Figure 7.
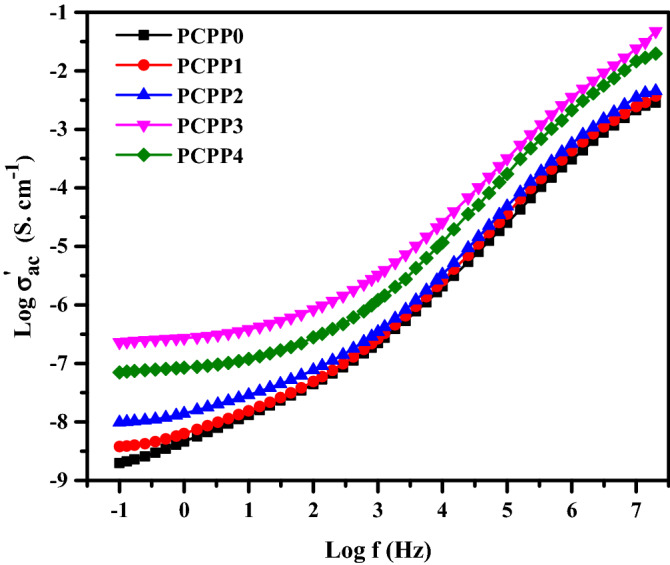
Log AC conductivity versus log frequency for all films at room temperature.
Dielectric studies
It is well known that the dielectric spectroscopy of polymeric materials is a powerful technique to understand the variation of electrical conductivity mechanisms. So, the dielectric data of the nanocomposite films were analyzed using the complex dielectric constant as following52,53:
| 3 |
where is the real part of the relative permittivity (dielectric constant), is the imaginary part of the relative permittivity (dielectric loss), C is the capacitance of the film, d is the film’s thickness, A is the surface area of the electrodes, and 8.85 10−12 F/m is the free space-permittivity. The value measures the amount of charge that can be stored by the material, whereas the the amount of energy lost. Plots of both and against log f of the nanocomposite films at room temperature are shown in Fig. 8a and b, respectively. It is seen that the behavior of and increase non-linearly with the decrease in frequency at room temperature. This phenomenon is more noticeable at lower frequencies (f ˂ 102 Hz). The increase in permittivity with the decrease of frequency indicates that the system shows interfacial polarization at a low frequency54. On the other hand, the response of charge carriers at low frequency is faster with an externally applied electric signal, resulting in a higher value of . The values of and increased with increasing Ag NPs content until PCPP3 nanocomposite film. This can be attributed to an increase in the density of Ag ion carriers as well as an increase in polarization. However, when the Ag NPs increased above the PCPP3 sample, the values of the dielectric constant and dielectric loss were reversed. This decrease in and values could be related to the reduction of Ag-ion carriers to Ag particles. At high frequency, the permittivity values are found almost independent of the frequency due to the charge carriers being unable to reorient themselves with the applied electric field. Furthermore, ion oscillations may be the only source of the dielectric constant at high frequency, so is frequency independent. These results suggest that the dielectric constant might be used to evaluate the conductivity of the nanocomposite films.
Figure 8.
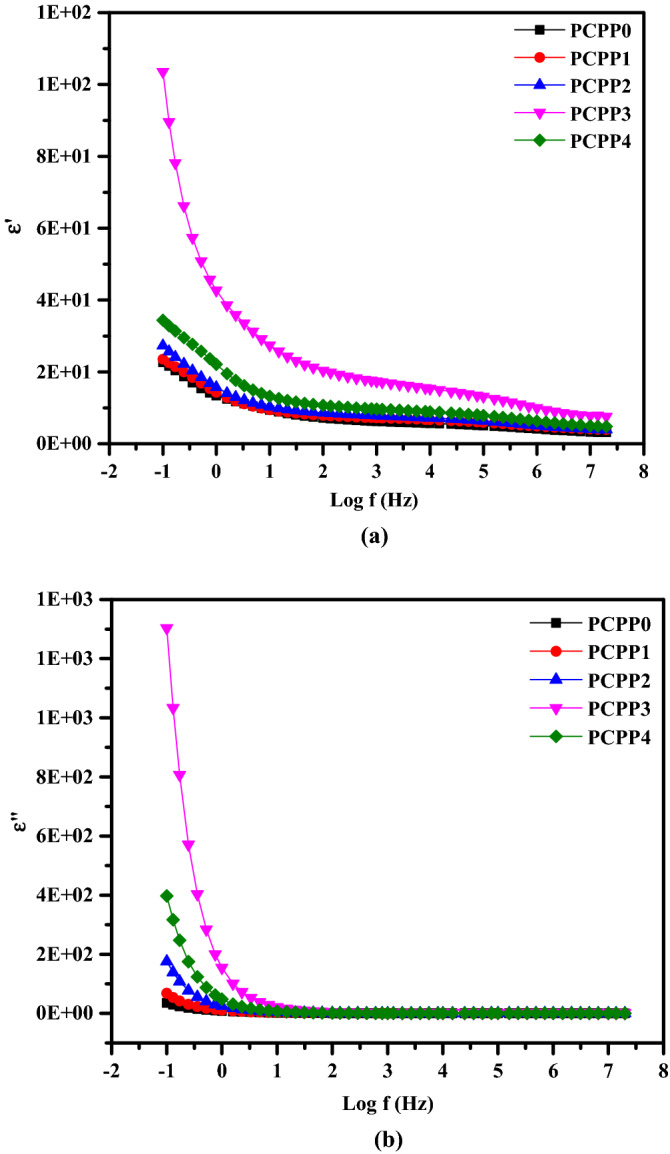
Frequency-dependent (a) real part ε′ and (b) imaginary part ε″ of the complex dielectric permittivity for all films at room temperature.
Impedance analysis
Impedance spectroscopy is a well-known technique used to determine ion dynamics in polymer electrolyte systems. In the current SPE, ac impedance measurements were used to illustrate electrolyte conductivity and frequency-dependent action. The Cole–Cole plots (Nyquist plots) for nanocomposite films based on SPE at room temperature are shown in Fig. 9. The obtained complex impedance spectra show two distinct regions; the high-frequency semi-circle region, which is due to the ionic conducting nature in the bulk of the polymer electrolytes, and the low-frequency spike, which is due to the blocking electrode (space charge polarization effect)55. To clarify the relationship between microstructure and electrical characteristics, impedance data is often represented as an equivalent electric circuit consisting of resistance and capacitance. The impedance data were fitted with an equivalent circuit using EIS software. As shown in the inset Fig. 9a–e, this equivalent circuit of the PNC films consists of a parallel combination of resistance Rb and fractal capacity CPE1 in series with other fractal capacity CPE2. A CPE is a constant phase element that indicates a deviation from the ideal Debye-type model. Rb represents the bulk resistance in this model, and it can be calculated using the low-frequency intercept of the semi-circle on the Z′ axis. CPE1 and CPE2 are simple distributed components that provide impedance with a constant phase angle in the complex plane. The impedance of the CPE is described by the following formula:
| 4 |
where Q represents the numerical value of 1/ at = 1 rad s−1 and n represents the phase of the components, which gives the degree of deviation from the pure capacitor. The parameters of the equivalent electric circuit model are derived by fitting the curves in Fig. 9 are listed in Table 2. It can be noticed that the Rb decreases as the Ag NPs concentration increases. Also, the semi-circle centers are observed to be below the Z′- axis. This implies that the ions’ relaxation in the prepared samples is non-Debye kind. The lack of a high-frequency semi-circle indicates that overall conductivity is mostly due to ion conduction56,57.
Figure 9.

(a–e) Nyquist plots of the prepared nanocomposite films.
Table 2.
The extracted parameters of the equivalent electric circuit model.
| Films | Fitting parameters | ||||
|---|---|---|---|---|---|
| Rb (k Ω) | Q1 (F) | n1 | Q2 (F) | n2 | |
| PCPP0 | 142 | 3.3 × 10⁻⁵ | 0.3 | 4.18 × 10⁻⁷ | 0.94 |
| PCPP1 | 118 | 6.35 × 10⁻⁷ | 0.46 | ||
| PCPP2 | 41 | 8.14 × 10⁻⁶ | 0.77 | ||
| PCPP3 | 0.450 | 2.48 × 10⁻⁵ | 0.99 | ||
| PCPP4 | 0.252 | 6.61 × 10⁻⁵ | 0.82 | ||
Conclusions
In summary, we incorporated various amounts of Ag NPs into PVA/CMC/PEDOT:PSS composite to prepare the solid nanocomposite electrolyte. The solution casting approach was used to prepare the nanocomposite films, and the obtained films were physically and electrically characterized. PVA and CMC are utilized as hydrophilic structures, which provide flexibility to the films. The presence of the PEDOT:PSS provides the conductivity of the films. FT-IR spectra reveal the complex formation between the Ag NPs and PVA/CMC/PEDOT: PSS nanocomposites, and the complexation of polymers composite each other. The XRD pattern shows that the amorphous nature of the films increases with the addition of the Ag NPs, and three characteristic diffraction peaks confirmed the presence of Ag NPs. Furthermore, it was noticed that increasing the Ag NPs concentration has a significant influence on reducing the optical band gap energies. SEM images revealed the miscibility between the PVA, CMC, and PEDOT:PSS by a homogeneous smooth surface. Moreover, the surface structure of the PNC films is influenced by the Ag NPs filling ratio. The optical characteristics of the PNC films indicated that as the concentration of the Ag NPs increased, the absorbance increased while the optical band gap decreased. The AC conductivity values for the prepared films were increased up to the optimal nanocomposite film PCPP3, which can be ascribed to the increased contribution of Ag ion carriers to the conductivity and polarization mechanisms. Both and also increased at the optimal nanocomposite film PCPP3 which in turn facilitates the charge carriers’ mobility. Also, the reduction in the diameter of semi-circle impedance plots indicates an increase in ionic conductivity. Further addition of Ag NPs in the composite films reduced the , , and due to the increase in the rate of Ag ion reduction.
Author contributions
E.S. planned and performed the experiments and wrote the manuscript. W.H. performed the experiments and wrote the methods. A.H.O. supervised the work and edited the manuscript. A.G.E. was also involved in the supervision.
Funding
Open access funding provided by The Science, Technology & Innovation Funding Authority (STDF) in cooperation with The Egyptian Knowledge Bank (EKB).
Data availability
All data generated during this study are included in this published article.
Competing interests
The authors declare no competing interests.
Footnotes
Publisher's note
Springer Nature remains neutral with regard to jurisdictional claims in published maps and institutional affiliations.
References
- 1.Xue C, et al. Morphology of PI–PEO block copolymers for lithium batteries. Polymer (Guildf) 2006;47:6149–6155. doi: 10.1016/j.polymer.2006.06.024. [DOI] [Google Scholar]
- 2.Wu I-D, Chang F-C. Determination of the interaction within polyester-based solid polymer electrolyte using FTIR spectroscopy. Polymer (Guildf) 2007;48:989–996. doi: 10.1016/j.polymer.2006.12.045. [DOI] [Google Scholar]
- 3.Sedlařík V, Saha N, Kuřitka I, Sáha P. Characterization of polymeric biocomposite based on poly(vinyl alcohol) and poly(vinyl pyrrolidone) Polym. Compos. 2006;27:147–152. doi: 10.1002/pc.20197. [DOI] [Google Scholar]
- 4.Jipa IM, et al. Effect of gamma irradiation on biopolymer composite films of poly(vinyl alcohol) and bacterial cellulose. Nucl. Instrum. Methods Phys. Res. B. 2012;278:82–87. doi: 10.1016/j.nimb.2012.02.024. [DOI] [Google Scholar]
- 5.Azmi S, et al. Reinforcement of poly(vinyl alcohol) hydrogel with halloysite nanotubes as potential biomedical materials. Soft Mater. 2017;15:45–54. doi: 10.1080/1539445X.2016.1242500. [DOI] [Google Scholar]
- 6.Luna-Martínez JF, et al. Synthesis and optical characterization of ZnS–sodium carboxymethyl cellulose nanocomposite films. Carbohydr. Polym. 2011;84:566–570. doi: 10.1016/j.carbpol.2010.12.021. [DOI] [Google Scholar]
- 7.Xiao C, Gao Y. Preparation and properties of physically crosslinked sodium carboxymethylcellulose/poly(vinyl alcohol) complex hydrogels. J. Appl. Polym. Sci. 2008;107:1568–1572. doi: 10.1002/app.27203. [DOI] [Google Scholar]
- 8.Taleb MFA, El-Mohdy HLA, El-Rehim HAA. Radiation preparation of PVA/CMC copolymers and their application in removal of dyes. J. Hazard Mater. 2009;168:68–75. doi: 10.1016/j.jhazmat.2009.02.001. [DOI] [PubMed] [Google Scholar]
- 9.Chalmers E, Lee H, Zhu C, Liu X. Increasing the conductivity and adhesion of polypyrrole hydrogels with electropolymerized polydopamine. Chem. Mater. 2020;32:234–244. doi: 10.1021/acs.chemmater.9b03655. [DOI] [Google Scholar]
- 10.Han L, et al. Transparent, adhesive, and conductive hydrogel for soft bioelectronics based on light-transmitting polydopamine-doped polypyrrole nanofibrils. Chem. Mater. 2018;30:5561–5572. doi: 10.1021/acs.chemmater.8b01446. [DOI] [Google Scholar]
- 11.Yin J, et al. Self-assembled functional components-doped conductive polypyrrole composite hydrogels with enhanced electrochemical performances. RSC Adv. 2020;10:10546–10551. doi: 10.1039/D0RA00102C. [DOI] [PMC free article] [PubMed] [Google Scholar]
- 12.Lin Y, Zhang H, Liao H, Zhao Y, Li K. A physically crosslinked, self-healing hydrogel electrolyte for nano-wire PANI flexible supercapacitors. Chem. Eng. J. 2019;367:139–148. doi: 10.1016/j.cej.2019.02.064. [DOI] [Google Scholar]
- 13.Zhong R, et al. Self-assembly of enzyme-like nanofibrous g-molecular hydrogel for printed flexible electrochemical sensors. Adv. Mater. 2018;30:1706887. doi: 10.1002/adma.201706887. [DOI] [PubMed] [Google Scholar]
- 14.Yang Y, Zhao G, Cheng X, Deng H, Fu Q. Stretchable and healable conductive elastomer based on PEDOT:PSS/natural rubber for self-powered temperature and strain sensing. ACS Appl. Mater. Interfaces. 2021;13:14599–14611. doi: 10.1021/acsami.1c00879. [DOI] [PubMed] [Google Scholar]
- 15.Azar MG, et al. Tough and flexible conductive triple network hydrogels based on agarose/polyacrylamide/polyvinyl alcohol and poly(3,4-ethylenedioxythiophene):polystyrene sulfonate. Polym. Int. 2021;70:1523–1533. doi: 10.1002/pi.6232. [DOI] [Google Scholar]
- 16.Zhang M, Yuan W, Yao B, Li C, Shi G. Solution-processed PEDOT:PSS/graphene composites as the electrocatalyst for oxygen reduction reaction. ACS Appl. Mater. Interfaces. 2014;6:3587–3593. doi: 10.1021/am405771y. [DOI] [PubMed] [Google Scholar]
- 17.Su Z, et al. Co-electro-deposition of the MnO2-PEDOT:PSS nanostructured composite for high areal mass, flexible asymmetric supercapacitor devices. J. Mater. Chem. A Mater. 2013;1:12432–12440. doi: 10.1039/c3ta13148c. [DOI] [Google Scholar]
- 18.Antiohos D, et al. Compositional effects of PEDOT-PSS/single walled carbon nanotube films on supercapacitor device performance. J. Mater. Chem. 2011;21:15987–15994. doi: 10.1039/c1jm12986d. [DOI] [Google Scholar]
- 19.Yun D-J, Rhee S-W. Composite films of oxidized multiwall carbon nanotube and poly(3,4-ethylenedioxythiophene): Polystyrene sulfonate (PEDOT:PSS) as a contact electrode for transistor and inverter devices. ACS Appl. Mater. Interfaces. 2012;4:982–989. doi: 10.1021/am201622j. [DOI] [PubMed] [Google Scholar]
- 20.Yeh MH, et al. A composite catalytic film of PEDOT:PSS/TiN-NPs on a flexible counter-electrode substrate for a dye-sensitized solar cell. J. Mater. Chem. 2011;21:19021–19029. doi: 10.1039/c1jm12428e. [DOI] [Google Scholar]
- 21.Liu N, et al. Electrospun PEDOT:PSS–PVA nanofiber based ultrahigh-strain sensors with controllable electrical conductivity. J. Mater. Chem. 2011;21:18962. doi: 10.1039/c1jm14491j. [DOI] [Google Scholar]
- 22.Nikolou M, Malliaras GG. Applications of poly(3,4-ethylenedioxythiophene) doped with poly(styrene sulfonic acid) transistors in chemical and biological sensors. Chem. Rec. 2008;8:13–22. doi: 10.1002/tcr.20133. [DOI] [PubMed] [Google Scholar]
- 23.Gaabour LH. Effect of selenium oxide nanofiller on the structural, thermal and dielectric properties of CMC/PVP nanocomposites. J. Market. Res. 2020;9:4319–4325. [Google Scholar]
- 24.Kanmani P, Rhim J-W. Properties and characterization of bionanocomposite films prepared with various biopolymers and ZnO nanoparticles. Carbohydr. Polym. 2014;106:190–199. doi: 10.1016/j.carbpol.2014.02.007. [DOI] [PubMed] [Google Scholar]
- 25.Salim E. Charge extraction enhancement in hybrid solar cells using n-ZnO/p-NiO nanoparticles. J. Mater. Sci. Mater. Electron. 2021;32:28830–28839. doi: 10.1007/s10854-021-07267-6. [DOI] [Google Scholar]
- 26.Bikiaris DN, Triantafyllidis KS. HDPE/Cu-nanofiber nanocomposites with enhanced antibacterial and oxygen barrier properties appropriate for food packaging applications. Mater. Lett. 2013;93:1–4. doi: 10.1016/j.matlet.2012.10.128. [DOI] [Google Scholar]
- 27.Mathew M, Sureshkumar S, Sandhyarani N. Synthesis and characterization of gold–chitosan nanocomposite and application of resultant nanocomposite in sensors. Colloids Surf. B Biointerfaces. 2012;93:143–147. doi: 10.1016/j.colsurfb.2011.12.028. [DOI] [PubMed] [Google Scholar]
- 28.Rhim JW, Wang LF, Hong SI. Preparation and characterization of agar/silver nanoparticles composite films with antimicrobial activity. Food Hydrocoll. 2013;33:327–335. doi: 10.1016/j.foodhyd.2013.04.002. [DOI] [Google Scholar]
- 29.El-Nahrawy AM, AbouHammad AB, Khattab TA, Haroun A, Kamel S. Development of electrically conductive nanocomposites from cellulose nanowhiskers, polypyrrole and silver nanoparticles assisted with Nickel(III) oxide nanoparticles. React. Funct. Polym. 2020;149:104533. doi: 10.1016/j.reactfunctpolym.2020.104533. [DOI] [Google Scholar]
- 30.Mansur HS, Sadahira CM, Souza AN, Mansur AAP. FTIR spectroscopy characterization of poly (vinyl alcohol) hydrogel with different hydrolysis degree and chemically crosslinked with glutaraldehyde. Mater. Sci. Eng. C. 2008;28:539–548. doi: 10.1016/j.msec.2007.10.088. [DOI] [Google Scholar]
- 31.Luo S, et al. Excellent self-healing and antifogging coatings based on polyvinyl alcohol/hydrolyzed poly(styrene-co-maleic anhydride) J. Mater. Sci. 2019;54:5961–5970. doi: 10.1007/s10853-018-03279-6. [DOI] [Google Scholar]
- 32.Qashou SI, El-Zaidia EFM, Darwish AAA, Hanafy TA. Methylsilicon phthalocyanine hydroxide doped PVA films for optoelectronic applications: FTIR spectroscopy, electrical conductivity, linear and nonlinear optical studies. Phys. B Condens. Matter. 2019;571:93–100. doi: 10.1016/j.physb.2019.06.063. [DOI] [Google Scholar]
- 33.Shi D, Wang F, Lan T, Zhang Y, Shao Z. Convenient fabrication of carboxymethyl cellulose electrospun nanofibers functionalized with silver nanoparticles. Cellulose. 2016;23:1899–1909. doi: 10.1007/s10570-016-0918-x. [DOI] [Google Scholar]
- 34.Pasha A, Khasim S. Highly conductive organic thin films of PEDOT–PSS:silver nanocomposite treated with PEG as a promising thermo-electric material. J. Mater. Sci. Mater. Electron. 2020;31:9185–9195. doi: 10.1007/s10854-020-03448-x. [DOI] [Google Scholar]
- 35.Yu J, Gu W, Zhao H, Ji G. Lightweight, flexible and freestanding PVA/PEDOT: PSS/Ag NWs film for high-performance electromagnetic interference shielding. Sci. China Mater. 2021;64:1723–1732. doi: 10.1007/s40843-020-1557-3. [DOI] [Google Scholar]
- 36.Lee JH, et al. PEDOT-PSS embedded comb copolymer membranes with improved CO2 capture. J. Memb. Sci. 2016;518:21–30. doi: 10.1016/j.memsci.2016.06.025. [DOI] [Google Scholar]
- 37.Wang Y, Qu Z, Wang W, Yu D. PVA/CMC/PEDOT:PSS mixture hydrogels with high response and low impedance electronic signals for ECG monitoring. Colloids Surf. B Biointerfaces. 2021;208:112088. doi: 10.1016/j.colsurfb.2021.112088. [DOI] [PubMed] [Google Scholar]
- 38.Yu J, Gu W, Zhao H, Ji G. Lightweight, flexible and freestanding PVA/PEDOT: PSS/Ag NWs film for high-performance electromagnetic interference shielding. Sci. China Mater. 2021;64:1723–1732. doi: 10.1007/s40843-020-1557-3. [DOI] [Google Scholar]
- 39.Jasna M, Pushkaran NK, Manoj M, Aanandan CK, Jayaraj MK. Facile Preparation of lightweight and flexible PVA/PEDOT:PSS/MWCNT ternary composite for high-performance EMI shielding in the X-band through absorption mechanism. J. Electron. Mater. 2020;49:1689–1701. doi: 10.1007/s11664-019-07676-8. [DOI] [Google Scholar]
- 40.El-Bana MS, Mohammed G, el Sayed AM, El-Gamal S. Preparation and characterization of PbO/carboxymethyl cellulose/polyvinylpyrrolidone nanocomposite films. Polym. Compos. 2018;39:3712–3725. doi: 10.1002/pc.24402. [DOI] [Google Scholar]
- 41.Wang X, et al. Enhancement of thermoelectric performance of PEDOT:PSS films by post-treatment with a superacid. RSC Adv. 2018;8:18334–18340. doi: 10.1039/C8RA02058B. [DOI] [PMC free article] [PubMed] [Google Scholar]
- 42.Rangari VK, et al. Synthesis of Ag/CNT hybrid nanoparticles and fabrication of their Nylon-6 polymer nanocomposite fibers for antimicrobial applications. Nanotechnology. 2010;21:095102. doi: 10.1088/0957-4484/21/9/095102. [DOI] [PubMed] [Google Scholar]
- 43.Hassen A, el Sayed AM, Morsi WM, El-Sayed S. Influence of Cr2O3 nanoparticles on the physical properties of polyvinyl alcohol. J Appl Phys. 2012;112:093525. doi: 10.1063/1.4764864. [DOI] [Google Scholar]
- 44.Alshehari AM, Salim E, Oraby AH. Structural, optical, morphological and mechanical studies of polyethylene oxide/sodium alginate blend containing multi-walled carbon nanotubes. J. Market. Res. 2021;15:5615–5622. [Google Scholar]
- 45.Devi CU, Sharma AK, Rao VVRN. Electrical and optical properties of pure and silver nitrate-doped polyvinyl alcohol films. Mater. Lett. 2002;56:167–174. doi: 10.1016/S0167-577X(02)00434-2. [DOI] [Google Scholar]
- 46.Nasrallah DA, Ibrahim MA. Enhancement of physico-chemical, optical, dielectric and antimicrobial properties of polyvinyl alcohol/carboxymethyl cellulose blend films by addition of silver doped hydroxyapatite nanoparticles. J. Polym. Res. 2022;29:86. doi: 10.1007/s10965-022-02943-5. [DOI] [Google Scholar]
- 47.Aziz SB, Abidin ZHZ, Kadir MFZ. Innovative method to avoid the reduction of silver ions to silver nanoparticles. Phys. Scr. 2015;90:035808. doi: 10.1088/0031-8949/90/3/035808. [DOI] [Google Scholar]
- 48.Aziz SB, Abidin ZHZ, Kadir MFZ. Innovative method to avoid the reduction of silver ions to silver nanoparticles. Phys. Scr. 2015;90:035808. doi: 10.1088/0031-8949/90/3/035808. [DOI] [Google Scholar]
- 49.Bouaamlat H, et al. Dielectric properties, AC conductivity, and electric modulus analysis of bulk ethylcarbazole-terphenyl. Adv. Mater. Sci. Eng. 2020;2020:1–8. doi: 10.1155/2020/8689150. [DOI] [Google Scholar]
- 50.Arya A, Sharma AL. Structural, electrical properties and dielectric relaxations in Na+ -ion-conducting solid polymer electrolyte. J. Phys. Condens. Matter. 2018;30:165402. doi: 10.1088/1361-648X/aab466. [DOI] [PubMed] [Google Scholar]
- 51.Abdelrazek EM, Abdelghany AM, Tarabiah AE, Zidan HM. AC conductivity and dielectric characteristics of PVA/PVP nanocomposite filled with MWCNTs. J. Mater. Sci. Mater. Electron. 2019;30:15521–15533. doi: 10.1007/s10854-019-01929-2. [DOI] [Google Scholar]
- 52.Zeyada HM, El-Taweel FM, El-Nahass MM, El-Shabaan MM. Effect of substitution group on dielectric properties of 4H-pyrano [3, 2-c] quinoline derivatives thin films. Chin. Phys. B. 2016;25:077701. doi: 10.1088/1674-1056/25/7/077701. [DOI] [Google Scholar]
- 53.Sengwa RJ, Choudhary S. Dielectric and electrical properties of PEO–Al2O3nanocomposites. J. Alloys Compd. 2017;701:652–659. doi: 10.1016/j.jallcom.2017.01.155. [DOI] [Google Scholar]
- 54.George M, Nair SS, Malini KA, Joy PA, Anantharaman MR. Finite size effects on the electrical properties of sol-gel synthesized CoFe2O4 powders: Deviation from Maxwell–Wagner theory and evidence of surface polarization effects. J. Phys. D Appl. Phys. 2007;40:1593–1602. doi: 10.1088/0022-3727/40/6/001. [DOI] [Google Scholar]
- 55.Karthikeyan A, Vinatier P, Levasseur A. Study of lithium glassy solid electrolyte/electrode interface by impedance analysis. Bull. Mater. Sci. 2000;23:179–183. doi: 10.1007/BF02719906. [DOI] [Google Scholar]
- 56.Khiar ASA, Arof AK. Conductivity studies of starch-based polymer electrolytes. Ionics (Kiel) 2010;16:123–129. doi: 10.1007/s11581-009-0356-y. [DOI] [Google Scholar]
- 57.Hema M, Selvasekerapandian S, Hirankumar G. Vibrational and impedance spectroscopic analysis of poly(vinyl alcohol)-based solid polymer electrolytes. Ionics (Kiel) 2007;13:483–487. doi: 10.1007/s11581-007-0143-6. [DOI] [Google Scholar]
Associated Data
This section collects any data citations, data availability statements, or supplementary materials included in this article.
Data Availability Statement
All data generated during this study are included in this published article.