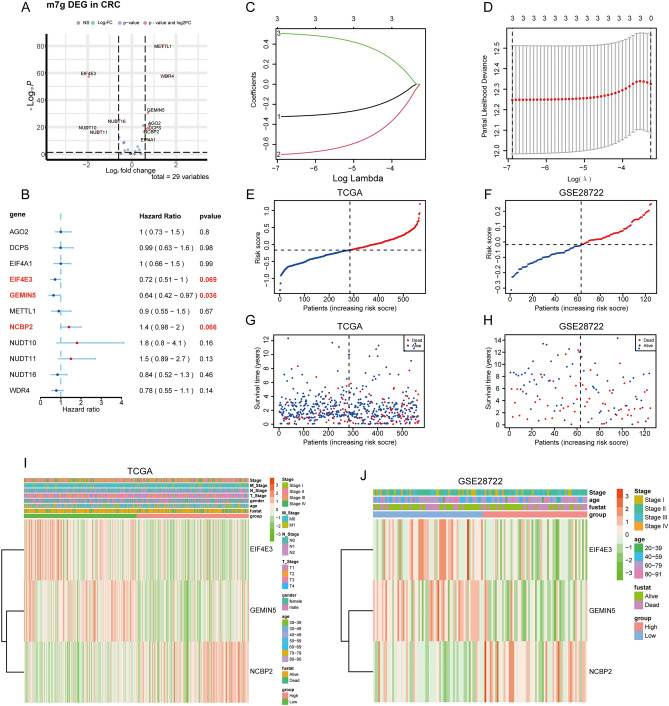
Figure 2.
MRS model construction. (A) The volcano map depicts 29 identified m7g-related genes visualized by EnhancedVolcano package in R language (version 4.1.2). (B) Selection of m7G-associated genes exhibiting significance in univariate Cox analyses (|logFC|> 0.6, adj.P < 0.1). (C) Numbers and coefficient values for different λ values during model construction. (D) Continuous adjustment of potential model parameters ultimately yielded the best model (left dashed line) and the simplest model (right dashed line), with the above values corresponding to the number of model features at the indicated λ value. (E,F) Risk score distributions based on the m7G-associated gene model in the training and validation datasets. (G,H) Differences in survival outcomes between patients in the high- and low-MRS subgroups in the training and validation datasets. (I,J) Heatmap represents the expression levels of three selected m7g-related genes in individual patients, plotted using the pheatmap function in the pheatmap package of the R language (version 4.1.2).

