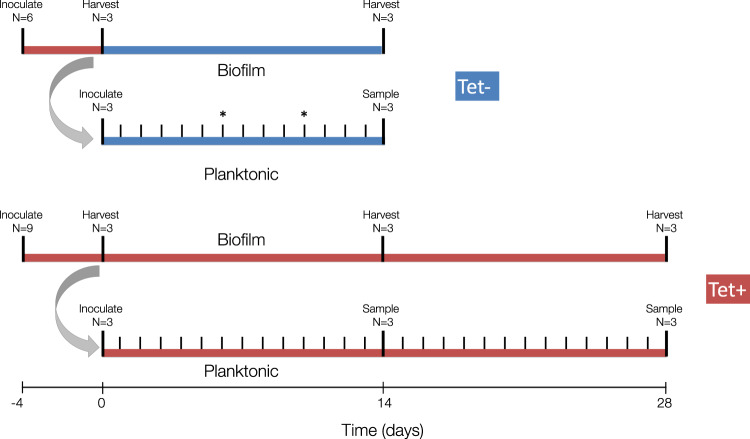
Fig. 1. Timeline of the evolution experiments.
Red represents time periods when media contained tetracycline (Tet+ treatment); blue represents the absence of antibiotics (Tet− treatment). Large ticks represent inoculation and harvest/sampling events. Four days prior to the initiation of the evolution experiments (−4), the biofilm flow cells were inoculated with the ancestral strain. Four days later, at day 0 (t0), the first set of randomly selected flow cells (n = 3) was harvested. A subsample of the cell suspensions from each of these replicates was used to inoculate each of the three planktonic populations (gray curved arrow). Small tick marks indicate the daily serial passage of planktonic populations. Asterisks on days 6 and 10 in the timeline of the Tet− planktonic populations indicate the last day at which plasmid-containing cells were detected in two of the three populations due to rapid plasmid loss; these time points were the final sampling points for these two populations (t6 and t10). The Tet− experiment was terminated after 14 days, and the Tet+ experiment after 28. For more details on the actual protocol, see Materials and Methods and Ridenhour et al.43.

